


This graphic charts the American dairy industry’s shift in milk production from small commercial farms to fewer, larger farms. Read more
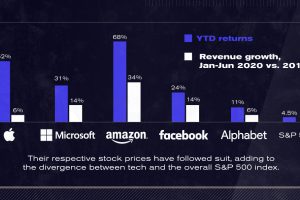
After a strong start to 2020, U.S. tech giants continue to advance to unprecedented highs. The Big Five now account for 25% of the S&P 500. Read more
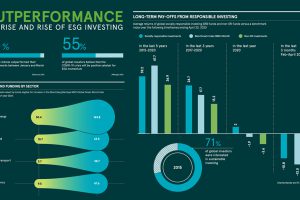
With ESG investing outperforming benchmarks, could green bonds be next in line? We unpack the megatrend taking hold of the financial world. Read more
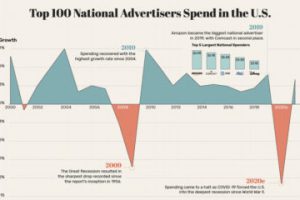
This graphic visualizes the fluctuations in advertising spend in the U.S., along with its brutal decline of 13% as a result of COVID-19. Read more
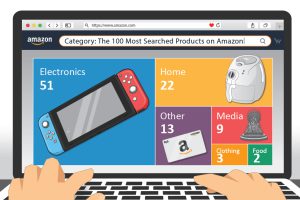
This graphic highlights the top product searches on Amazon in the U.S., providing a glimpse of what items American consumers are after. Read more
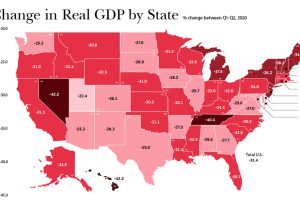
In just a few months, the U.S. economy reeled from COVID-19. As real change in GDP suffered, which states and industries were the hardest-hit? Read more

The Dow Jones Industrial Average is constantly evolving. This chart tracks which companies have come and gone since the inception of the index in 1928. Read more
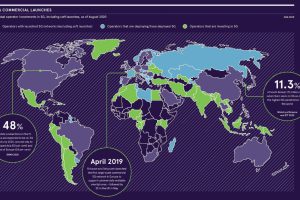
5G networks are at a tipping point. Where are we on the roadmap towards mainstream adoption, and which regions are leading the way? Read more

This infographic delves into five major forces reshaping our world and the new rules of leadership that CEOs should follow as a result. Read more
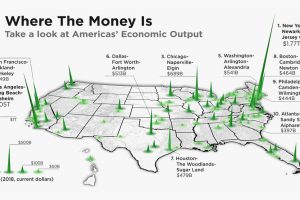
The total U.S. GDP stands at a whopping $21 trillion, but which metro areas contribute to the most in terms of economic output? Read more