

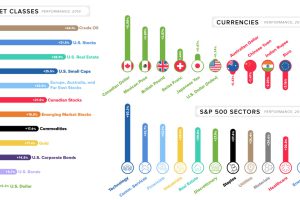
This quick graphic summary breaks down the final market numbers for 2019, looking at everything from currencies to broad asset classes. Read more
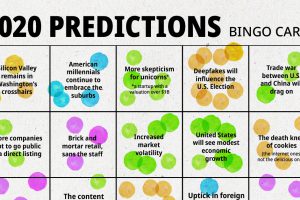
We analyzed 100+ articles, whitepapers, and interviews to answer the question: Is there a consensus on what we can expect in 2020? Read more
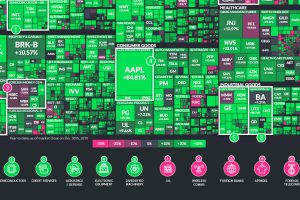
The U.S. stock market had a banner year, but some sectors were notable outliers. Here are the ones that outperformed (and underperformed) in 2019. Read more
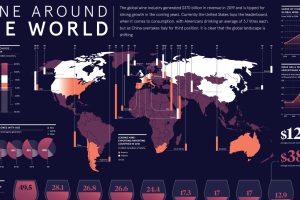
This infographic explores how changing consumer tastes and innovations in technology are impacting the global wine industry. Read more
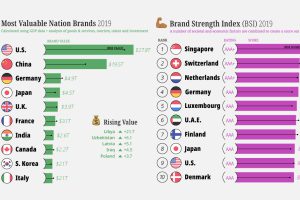
A country’s national image can have a big impact on its economic fortunes. See which countries have the highest ranked nation brands. Read more
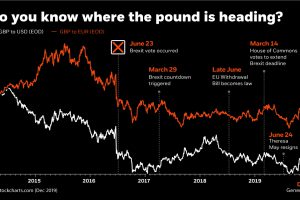
This infographic uses the recent Brexit-related volatility of the British pound to illustrate how currency risk can impact an investor’s portfolio. Read more
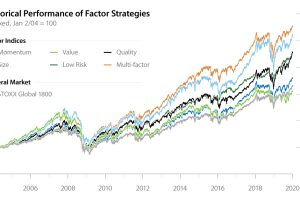
Factor investing has demonstrated its potential to outperform the general market for years. In this infographic, learn how to apply it in your portfolio. Read more
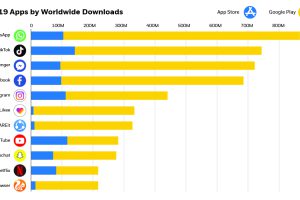
The app economy is expected to be over $6 trillion by 2021—see the world’s most downloaded apps and how they’re driving the future of this market. Read more
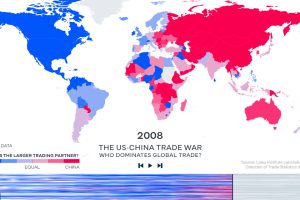
China has become the world’s major trading partner – and now, 128 of 190 countries trade more with China than they do with the United States. Read more
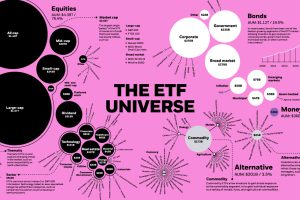
The global ETF universe has grown to be worth $5.75 trillion — here’s how the assets break down by type, sector, and investment focus. Read more