

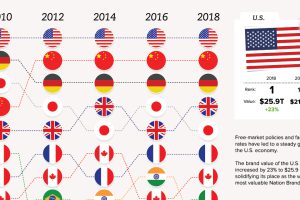
In a global marketplace, a country’s national image can be one of its most valued assets or a challenging liability. See how nation brands do in this ranking. Read more
This massive infographic shows the 15 corporations that make the most cars, their annual revenues, and the brands owned by each automaker. Read more
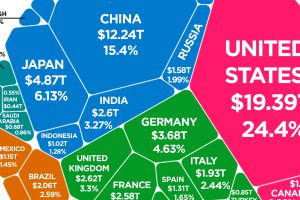
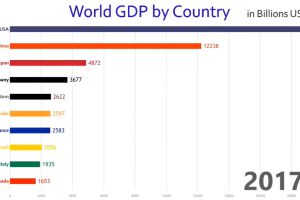
Latest estimates put the world economy at about $80 trillion in nominal GDP. Here is how each individual country stacks up in terms of size. Read more
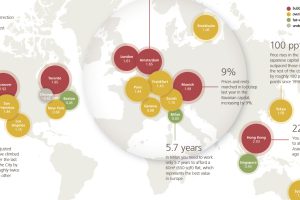
UBS says cracks are starting to show at the top end of the property market, according to the bank’s recent analysis of the biggest real estate bubbles globally. Read more
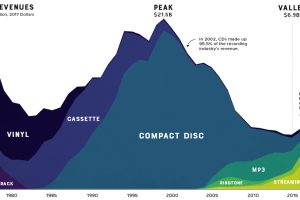
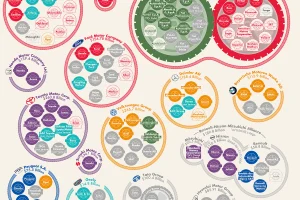
A revealing look at three decades of music industry sales. After a devastating decline, streaming services like Spotify are helping the industry regain its footing. Read more
This special feature uses powerful charts and infographics to visualize the eight major forces that are shaping our global economy and the business landscape. Read more

Our brain can be our own worst enemy. It’s hardwired to avoid pain, and to seek pleasure – and these instincts can wreak havoc on your investment portfolio. Read more
This rapid-paced animation shows year-by-year changes in GDP for the world’s 10 largest economies over the course of 57 years. Read more
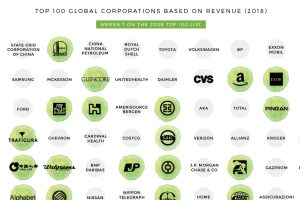
This nifty animated chart shows how the list of the world’s biggest companies by revenue have changed over the last decade. Read more
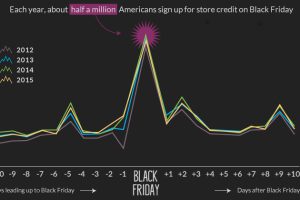
Black Friday is the kickoff to the holiday shopping season – and it often starts it with a bang. See the crazy retail numbers behind the big shopping day. Read more