

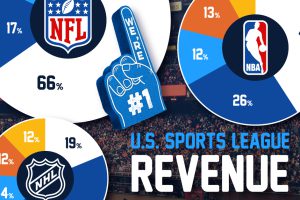
We break down the five major U.S. sports leagues by revenue as billions are generated from ticket sales, sponsorships, and media deals. Read more
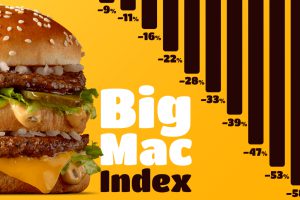
The price of a Big Mac varies substantially across the globe. The Big Mac Index uses these price variations to assess currency valuations. Read more
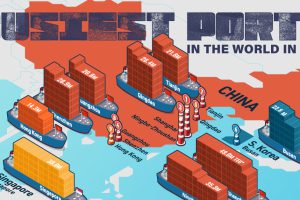
As critical nodes for trade and commercial activity, we show the top 10 busiest ports in the world by cargo volume. Read more
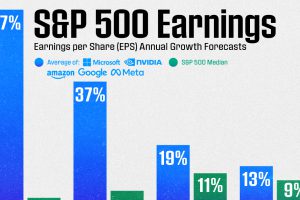
S&P 500 earnings growth is projected to increase moderately over the next few years, but lag behind mega-cap companies. Read more
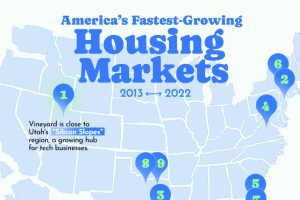
We ranked America’s 10 fastest growing housing markets, based on the growth of their housing stock from 2013 to 2022. Read more
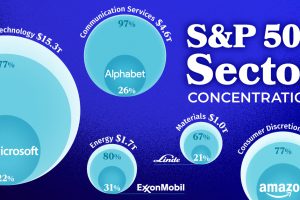
Among all sectors, Amazon makes up the greatest share of their sector, accounting for 39% of the Consumer Discretionary sector. Read more
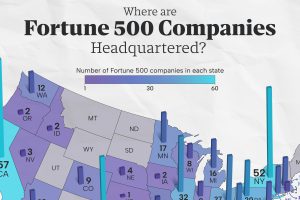
This map shows the number of Fortune 500 companies headquartered in each state. Which states have the highest concentration of large firms? Read more
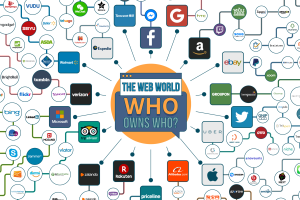
The tech world is becoming much more consolidated. This infographic shows the major entities owned by internet giants like Facebook, Amazon, and Google. Read more
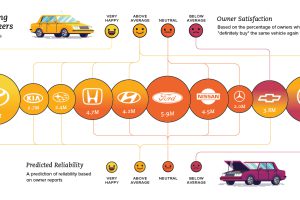
What car brands are rated the best in terms of reliability, owner satisfaction, and road tests? This series of charts shows you how auto brands perform. Read more
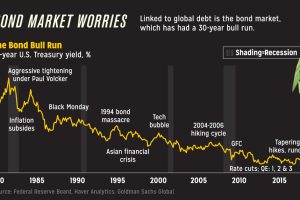
What market risks are the world’s most elite investors worried about, and how are they protecting themselves? Here is what is keeping billionaires up at night. Read more