

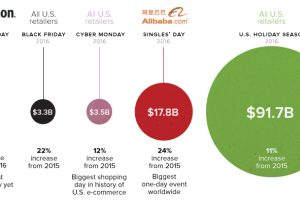
Amazon Prime Day raked in $1B in 2017, but is it bigger than Black Friday? See this, and the unknown Chinese holiday that blows both out of the water. Read more
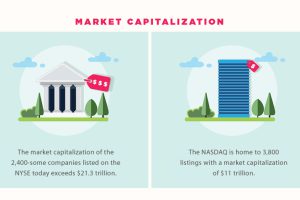
The NYSE and Nasdaq are the world’s two biggest stock exchanges, combining for $32 trillion in market cap – but they also have some significant differences. Read more
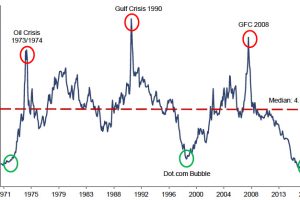
Here’s how all major commodities have done so far this year, as well as one chart that shows why they could still be very cheap for investors. Read more
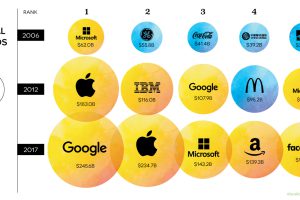
Tech titans like Google and Apple now dominate the list of the most valuable brands in the world. See how much all of these brands are worth in this chart. Read more
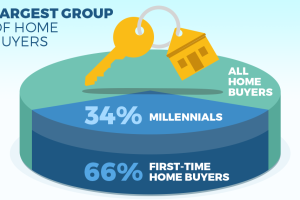
Most millennials plan to buy a house in the next five years – but why they buy, how they approach it, and what they want is different from past generations. Read more
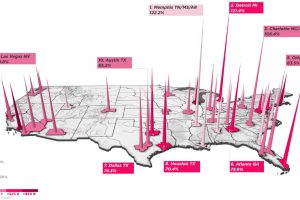
Women-owned businesses make up an increasing percentage of the American economy. Here are some of the cities where these businesses are being added the fastest. Read more
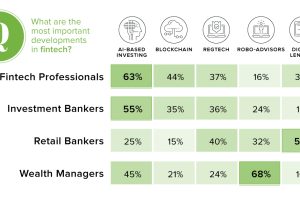
Is fintech a direct threat to the traditional financial services industry? Well, it turns out that the answer depends very much on who you are asking. Read more
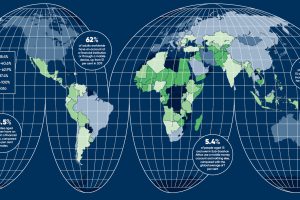
We take financial services for granted – but there are billions of people globally without them. This presents a unique opportunity to bank the ‘unbanked’. Read more

This interactive chart shows the breakeven prices that oil-rich countries need to pay for imports. We also dive into Venezuela’s specific crisis as well. Read more
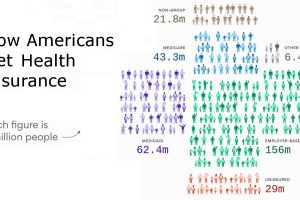
Here’s how Americans get healthcare coverage, using visualizations to show the numbers both nationally and for each individual state. Read more