

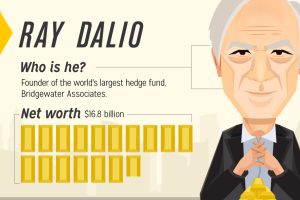
Billionaire investors like Ray Dalio are stocking up on gold. Here’s the ideas and strategies on gold from four elite investors, and what we can learn. Read more
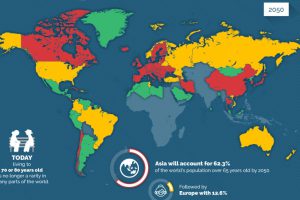
The percentage of the global population that is 65+ will double from 10% to 20% by 2050, creating potential economic headwinds especially for millennials. Read more
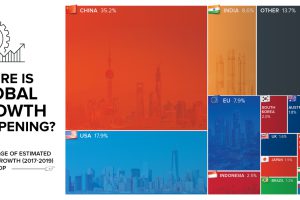
By 2019, the global economy is projected to expand another $6.5 trillion. Today’s chart shows which countries will help to fuel this global growth. Read more

Millions, billions, trillions – these are abstract numbers. Here’s what $20 trillion of U.S. debt looks like in terms of cold hard cash. Read more
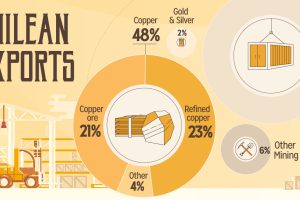
How Chile became a copper powerhouse, and how this helped to propel its economy to become the richest and freest in Latin America. Read more
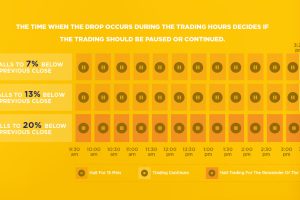
Here’s how ‘circuit breakers’ in the stock market work, and how these pauses are supposed to prevent the next market crash from happening. Read more
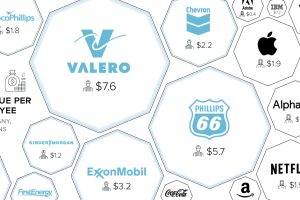
When it comes to revenue per employee, energy companies dominate. On average, oil companies bring in 2x more per employee than companies in other sectors. Read more
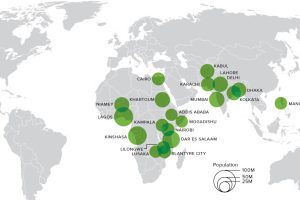
This animation shows big changes in the world’s most populous cities over the next 80+ years. Africa alone will hold 13 cities bigger than NYC by this time. Read more
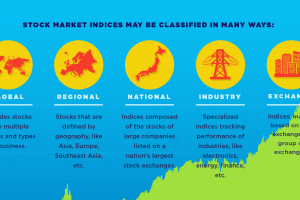
This infographic helps to explain the basics around what a stock market index is, and what it does. Read more

See the cities that the ultra-rich are buying in – and which cities are the up-and-comers in the ever-changing market for luxury real estate. Read more