


A global push by lawmakers to eliminate the use of physical cash is accelerating. See who’s getting targeted in the War on Cash, and who’s in the crossfire. Read more
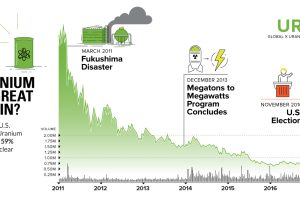
Uranium was the most hated commodity for the last 6 years – but things are changing. Trump could be a boon to the metal, with miners up 59% since election… Read more
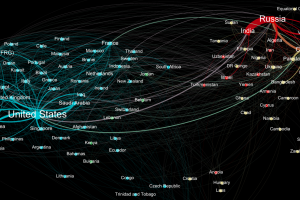
Who sends weapons to who? This data visualization represents the global weapons trade between countries, and it shines a light on two major blocs of trade. Read more
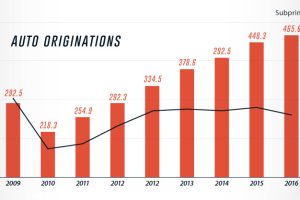
Auto loans have shot up past the $1 trillion mark in the U.S., and delinquencies in subprime auto loans are ticking upwards. Read more
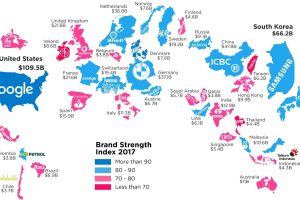
What is a top brand worth? This infographic highlights the most valuable brand in each country, according to the 2017 Brand Finance report. Read more
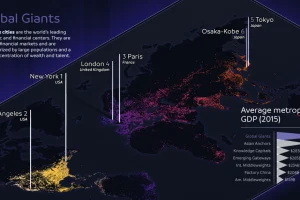
The world’s largest 123 cities generate an astonishing $36 trillion in GDP per year. This infographic breaks these global cities down into seven typologies. Read more
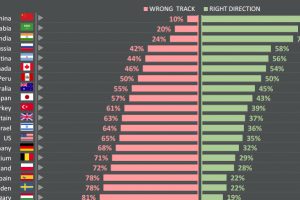
Do citizens think that their countries are heading in the right direction – or are they going down the wrong path? See survey results for 25 countries. Read more
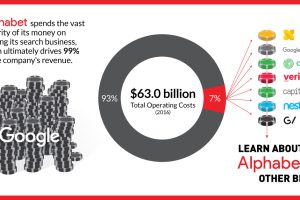
Google’s parent company Alphabet spent $4.4 billion in 2016 on ‘other bets’ – see the new ideas the company is betting on, and if they are successful so far. Read more
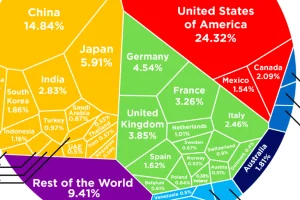
See how the multi-trillion dollar pie of the global economy gets divided between countries, based on the latest data from the World Bank from February 2017. Read more
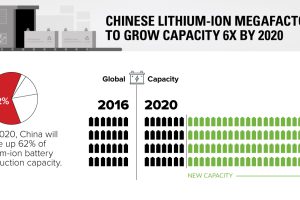
China’s li-ion battery production capacity will soon be 6x what it is today – and one of these megafactories may even be bigger than Tesla’s famous Gigafactory. Read more