


Here are nine ‘black swan’ events in recent memory that profoundly changed markets, ranging from the Asian financial crisis of 1997 to the more current Brexit. Read more
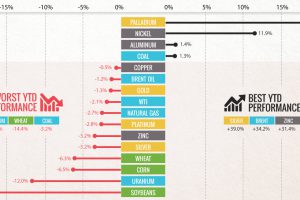
Commodities slumped in Q3 as buyers ‘sold in May and went away’. Can commodities shake the summer slump with a U.S. election and OPEC deal in Q4? Read more
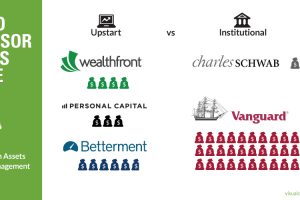
Can upstart robo-advisors compete against the scale of financial behemoths like Vanguard or Blackrock? See in this week’s chart. Read more

With zinc prices up over 35% in 2016, many metal investors are taking a second look at zinc. See 11 reasons to re-think zinc in this infographic. Read more
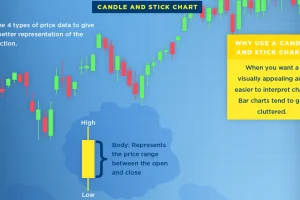
What is a stock chart? Here’s three of the most common types of stock charts, along with a description of the data they typically provide investors. Read more
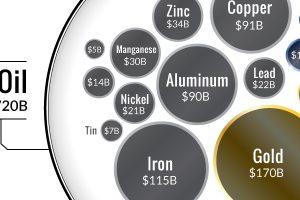
Ever wonder why the oil industry has so much influence? This chart shows that all metal markets combined don’t even come close to touching the oil market! Read more
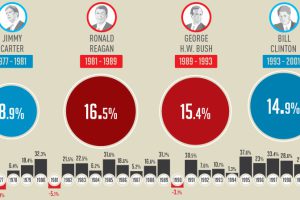
This infographic shows how the U.S. market performs in each year of a presidential term – and specifically, how the market does in election years. Read more
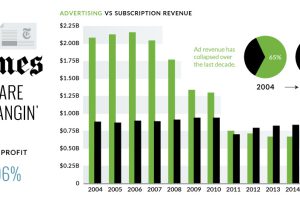
The New York Times just announced a 95.7% decrease in quarterly profits – we look at the numbers and context around the NYT’s digital transition. Read more
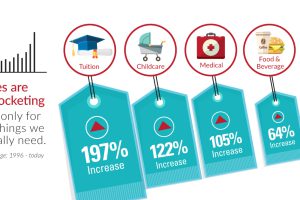
Over the last 20 years, the things that are the most important to us, such as healthcare, education, food, and shelter, have skyrocketing prices. Read more

Roughly 75% of all financial market volume comes from automated trading. Here’s how algorithms caused the flash crash in the British pound in early October. Read more