

There are multiple factors that determine how oil prices fluctuate, and many of them are interconnected. Learn about them all in this infographic. Read more
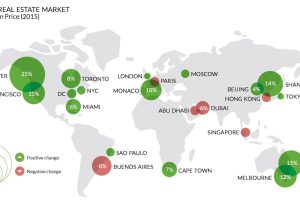
Which world-class cities are the ultra-rich flocking to? Which are they avoiding? The lopsided market for luxury properties helps tell the tale. Read more

The story of how Vancouver lost its affordability…and its mind. Read more
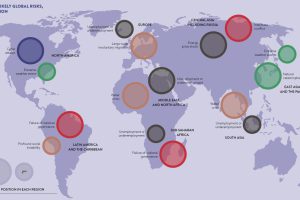
What are the largest risks to business this year? These graphics sum up the concerns of global business leaders to show the risks that could jeopardize markets. Read more

In Part 1 of our Battery Series, we look at battery basics, as well as the evolution of battery technology and how we got to today. Read more
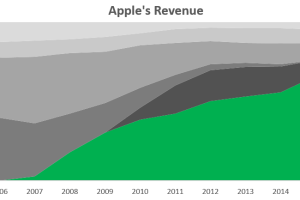
With iPhone sales making up over 60% of revenue, investors are becoming increasingly worried that Apple is a one trick pony. Read more
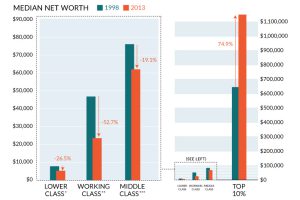
It’s clear to many Americans that the ‘system’ isn’t working for most people, and this chart sums up the wealth inequality problem perfectly. Read more

Brexit happened and markets are turned upside-down. However, this may only be just the beginning… Read more
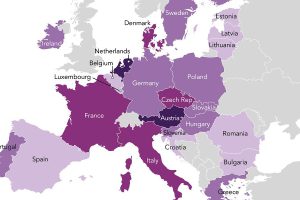
Europe’s got a fever, and the only prescription is…more referendums. Austria and Holland have been identified by Eurasia Group as the likely sources. Read more
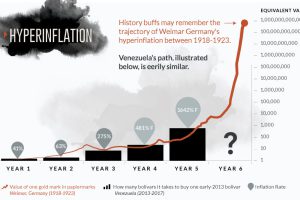
Does the chart for the Venezuelan bolivar look eerily familiar? Get a full perspective on Venezuelan hyperinflation with these two important visualizations. Read more