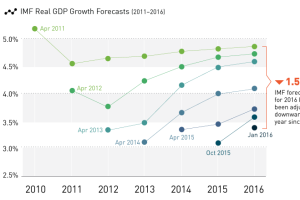
After five years of downward revisions to global real GDP growth, will next week’s IMF economic report finally be grounded in reality? Read more

The global economic climate finally has composure, according to asset management firm Schroders. It may be the calm before the storm, though. Read more
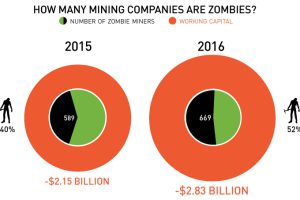
Mind-blowing fact: 52% of Canadian-listed mining companies are now considered “zombies”, or companies with negative working capital. Read more
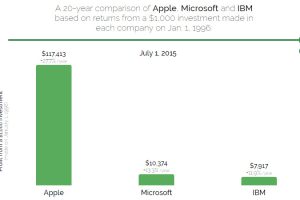
Going back 20 years, which stock would you buy? It turns out to be not even close between Apple and Microsoft. Read more
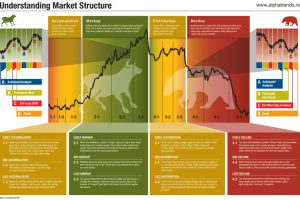
Understanding these different phases of the market cycle will help give you conviction on stock buying opportunities. Read more
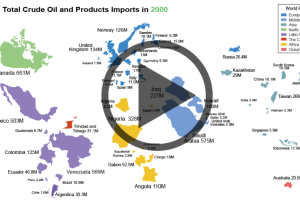
As the United States strives towards energy independence, watch how oil imports have dramatically shifted from the Middle East to a new oil source. Read more
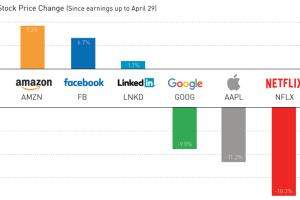
Earnings season has been a roller coaster for the world’s biggest tech companies. We sum up the action in today’s chart. Read more

These four maps tell the story of Chinese trade dominance and ambitions. See how Beijing’s sphere of influence is rapidly changing. Read more


