

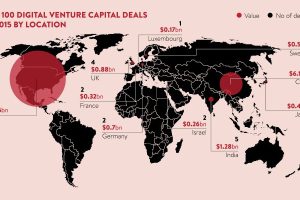
While 2015 was a record-setting year for venture capital, there is a devil in the details. Read more
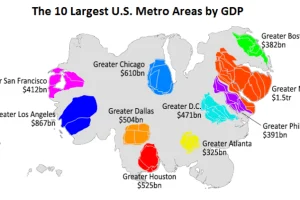
This animation uses county-level GDP data to re-size a U.S. map based on the economic contributions at a local level. Read more
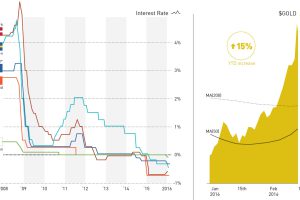
The BoJ describes Peter Pan as the inspiration behind their unprecedented monetary policy. Central bankers are following, but the market disagrees. Read more
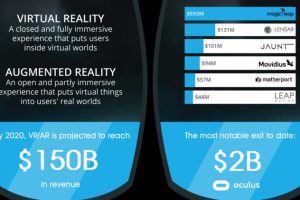
Virtual and augmented reality have come into focus as some of the most exciting technologies. Here’s the major players in the space and what to expect in 2016. Read more
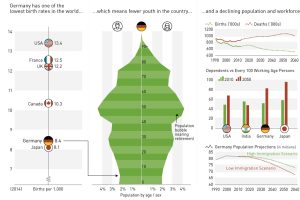
Germany’s demographic cliff, and why Europe’s largest economy could be destined to be the next Japan. Read more
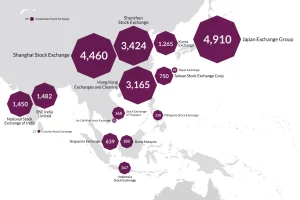
There’s 60 major stock exchanges in the world, ranging from the mighty NYSE to the tiny Bermuda stock market. Here they all are visualized by size and location. Read more
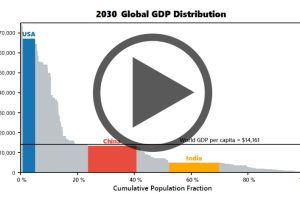
Watch the economies of the United States, China, and India evolve before your eyes from 1970 until 2030 (projected). Read more
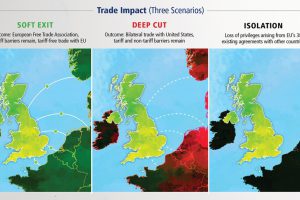
A potential British exit from the European Union, or Brexit, could have big ramifications for investors. Here’s the view from one think tank why a Brexit would be a losing… Read more
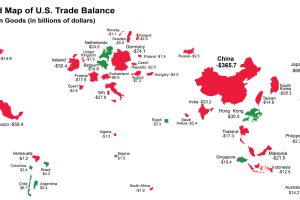
The U.S. has run a trade deficit for 40 years now. Where does that net foreign spending go? This map visualizes the data from 2015. Read more
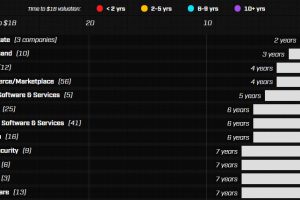
Here are the world’s 200+ tech unicorns sorted by geography, sector, and more. See the fastest startups to hit a $1 billion valuation. Read more