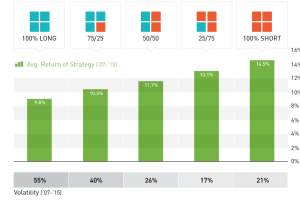
For decades, hedge fund style strategies have been used almost exclusively by wealthiest investors. Here’s how regular investors can use similar tactics. Read more
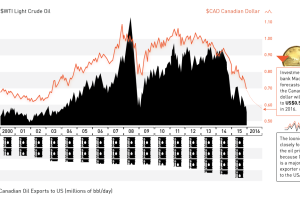
The oil plunge has wreaked havoc on the Canadian dollar. Now at 13-yr lows and expected to go lower, we explain the relationship between oil and the loonie. Read more
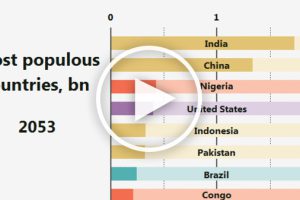
This animation shows how the ranking for the most populous countries in the world will change over more than 100 years. Read more
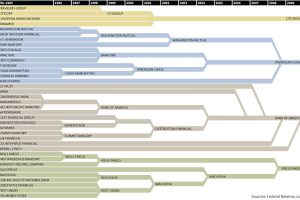
The Big Four retail banks in the United States hold 45%, or $4.6 trillion, of all customer bank deposits. This chart shows consolidation in banking. Read more
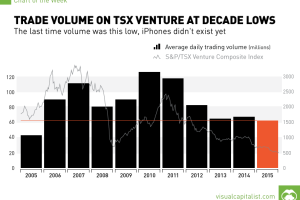
The last time volume was this low, the iPhone did not exist yet. Read more
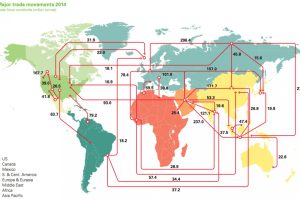
Every day, 93 million barrels of oil are consumed by the global economy. How does this oil change hands? This map visualizes the global oil trade. Read more

We look at 3 major themes that may suggest it is worth owning gold in 2016, ranging from the end of two-term US presidential terms to the gold-to-oil ratio. Read more

The Great Depression was the most severe economic depression ever experienced by the Western world. It was also the most famous case of deflation. Read more
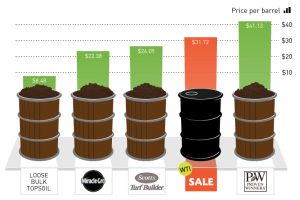
It costs the same amount as a barrel of Scotts Turf Builder. Read more


