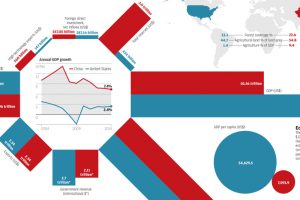
Today’s infographic looks at the economic differences between China and the United States: total reserves, GDP per capita, demographics, and much more. Read more
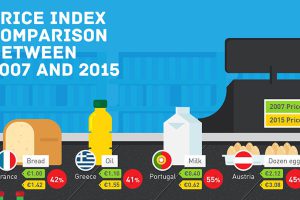
The euro has fallen precipitously since the beginning of the Financial Crisis in terms of USD. Crises plague the eurozone – will it be able to recover? Read more
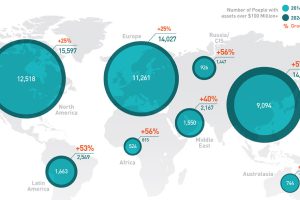
In the old days, speculators would follow the gold rushes. Now, it’s emerging markets that provide the big chance to become the next centimillionaire. Read more
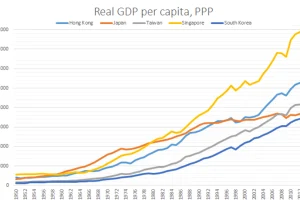
After 25 years of economic stagnation, Japan has finally been leapfrogged by all four so-called Asian Tigers: Hong Kong, Singapore, S. Korea, and Taiwan. Read more
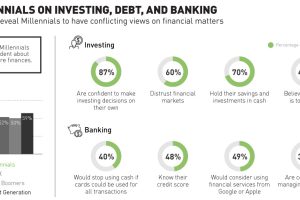
Millennials are the most confident generation about their financial future. At the same time, they seem to have conflicting views on investing, debt, and banking. Read more
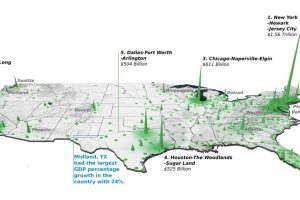
Did you know that the Top 20 metropolitan areas in the U.S. contribute 52% of the total country’s GDP? See how it breaks down by city in this 3d map. Read more

Which countries contribute the most to global economic growth? Over 80% of all growth is from 16 countries, and over half of all growth is from just two. Read more
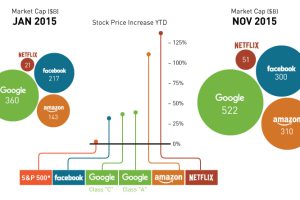
The FANG stocks (Facebook, Amazon, Netflix, and Google) are a group of tech companies that have carried the market this year, creating $440B in value YTD. Read more


