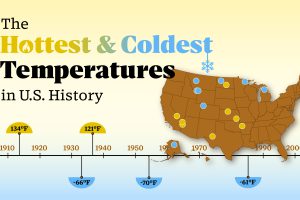
The highest temperature was registered in Death Valley, California, in 1913. Read more

Brazil is ranked seventh in the world with a total population of 217 million people. Read more
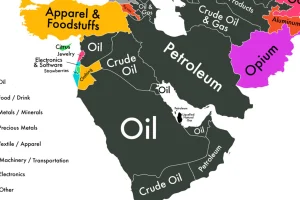
If we could only show you one map to explain the economy of the Middle East, it would be this one. Read more
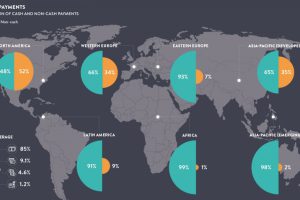
The world is increasingly becoming a cashless society. See the progress in this monumental shift, along with the pros and cons behind the death of cash. Read more

To make it into the Top 1% of US earners, you must make $521k. However, avg income of the 1% varies wildly at a county level, ranging from $127k to… Read more

Why is the South China Sea so important, and what is the basis for the ruling against China’s territorial claims? This in-depth graphical explainer tells it all. Read more
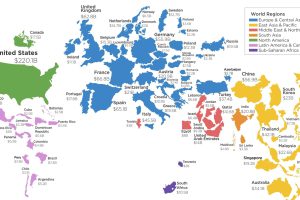
There is no shortage of sights to see in this world. See which countries rake in the most tourist dollars with this infographic map. Read more
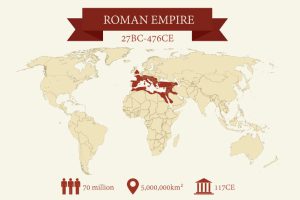
Like the stock market, the greatest empires in history have been cyclical in nature. We look at their rise and fall, and the lessons we can learn as investors. Read more


