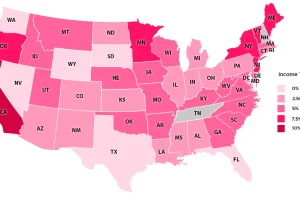
How green is the grass on the other side of the state border? See the U.S. states with the lowest income taxes in this series of maps and charts. Read more

How busy are the world’s shipping routes, and where are the global chokepoints for commercial shipping? See every ship’s movement on this interactive map. Read more
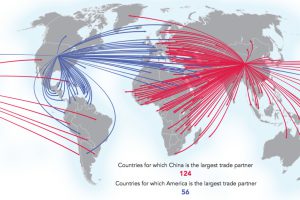
These four maps tell the story of Chinese trade dominance and ambitions. See how Beijing’s sphere of influence is rapidly changing. Read more
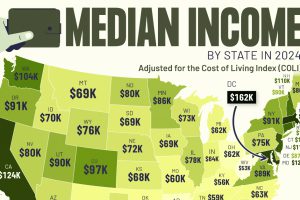
This graphic shows median income by state in 2024, adjusted for cost of living. Can you guess where it’s the highest? Read more
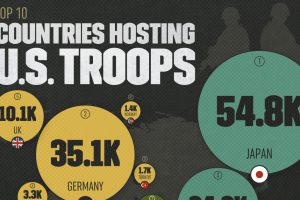
There are nearly 170,000 active duty American troops stationed overseas. And these 10 countries account for 90% of them. Read more

In June 2022, the U.S. Supreme Court overturned Roe v. Wade, opening the door for states to make their own decisions regarding abortion legality. How did states react? Read more
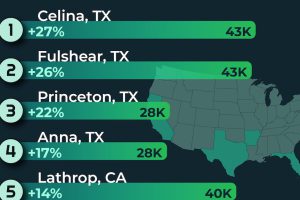
The Lone Star State has quite a few entrants on the latest fastest-growing American cities list. Read more
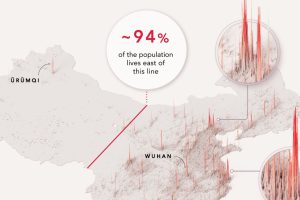
1.4 billion people live in a country stretching across 3.7 million square miles. Yet 94% of China’s population lives in only one half. Read more
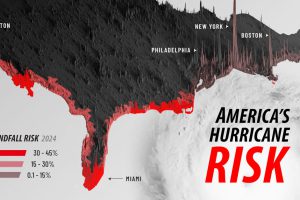
This map shows which areas have the most risk of a hurricane making landfall in 2024, along with major population centers. Read more

The highest temperature was registered in Death Valley, California, in 1913. Read more

