
The Iranian-backed group is using drones to attack vessels that they believe are delivering goods to Israel, forcing shipping companies cancel routes passing through the Red Sea. Read more

In this graphic, we show the most diverse states in the U.S. based on the Census Bureau’s Diversity Index. Read more

To offer perspective on the population of U.S. states, this map compares them to countries that share similar population sizes. Read more
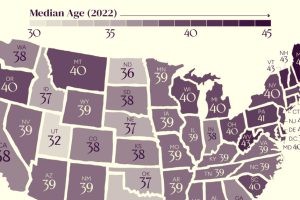
The U.S. might have a median age of 39, but the median age by state ranges from the low 30s to the mid 40s. Read more
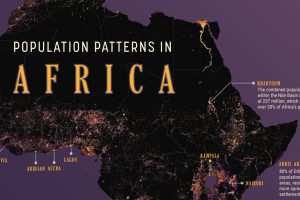
We map out Africa’s population density, spotlighting the continent’s most populous countries and cities. Read more
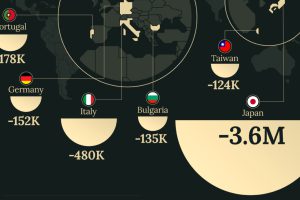
Despite the consumer class growing worldwide, some countries are predicted to see a decline in the number of consumers over the next decade. Read more

The most powerful passports have changed over the last decade, driven by political and economic factors. Here are the top 30 worldwide. Read more
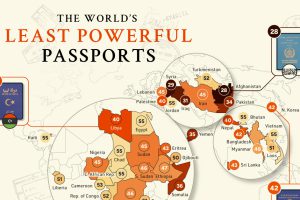
Which countries have the least powerful passports? Here’s how economic strength and political factors impact travel freedom in 2024. Read more
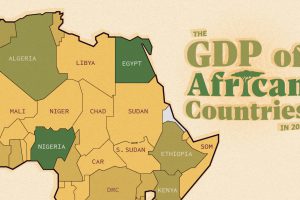
The top three economic powerhouses of Africa contribute more than one-third to the African economy. We rank the nations of the world’s second-largest continent by 2024 GDP estimates. Read more

Which states have the lowest credit card delinquency rates in America, and which have the highest? Read more

