

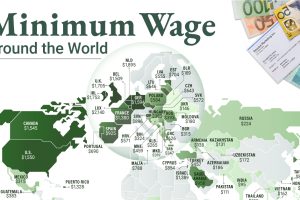
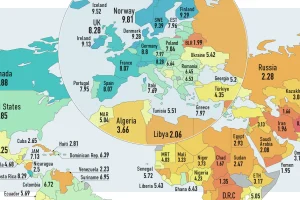
This infographic shows the net minimum wage across 67 countries, as of January 2023. A breakdown by U.S. state is also included. Read more
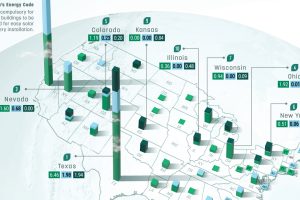
This graphic describes new U.S. renewable energy installations by state along with nameplate capacity, planned to come online in 2023. Read more
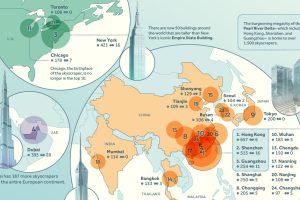
We rank the world’s leading cities with the most skyscrapers, highlighting China’s remarkable dominance in building vertically. Read more
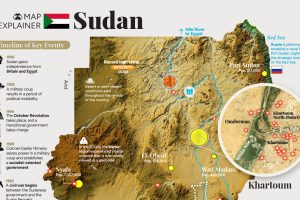
This comprehensive map explainer covers both key facts about Sudan, as well as information on the violent power struggle unfolding there Read more
How many countries globally are true democracies? This map showcases the state of democracy in every country worldwide. Read more
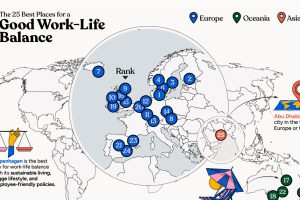
In this infographic, we explore which cities around the world excel in prioritizing work–life balance. Read more
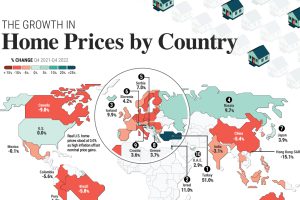
Global house prices were resilient in 2022, rising 6%. We compare nominal and real price growth by country as interest rates surged. Read more

Rivers and lakes have played important roles throughout history. This Vintage Viz looks at these bodies of water from the viewpoint of 1850. Read more
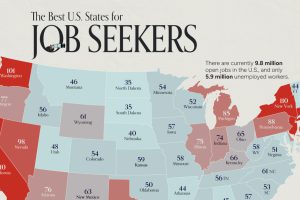
On average, there are 75 workers available for every 100 job openings across the country. Here’s how it varies by state. Read more
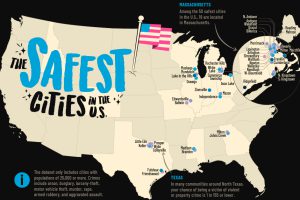
How safe is small town America? This map reveals the safest cities in the U.S. in terms of the total crime rate per every 1,000 residents. Read more