
We dug into the World University Rankings 2024 to uncover America’s best universities across nine census regions. Read more
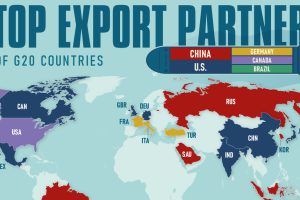
The U.S. and China were the top export markets for an equal number of G20 countries in 2022. But which countries were they? Read more

Which region has led global beer consumption for 15 consecutive years? This graphic shows the top beer-drinking regions worldwide. Read more
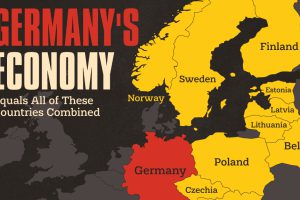
It takes Poland, Sweden, Austria, Norway, and 18 other countries together to match the might of Germany’s economy. Read more

About 46% of the American workforce, or 62 million people, are employed in a small business. Here’s the share breakdown by state. Read more

In 2022, the U.S. government agency in charge with enforcing national gun laws issued 18,784 gun manufacturer licenses. Read more

Million-dollar homes are on the rise in America. We show the number of cities in each states where a typical home costs $1 million or more. Read more
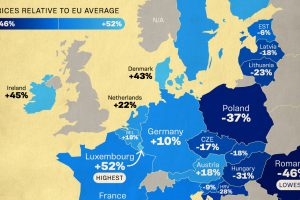
Which EU countries are the cheapest and the most expensive? See how prices compare relative to the EU average. Read more
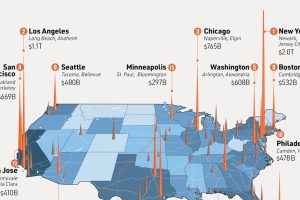
In this visual, we’ve ranked the top U.S. metropolitan areas in terms of their GDP. How does your city rank? Read more

From New York to Damascus, this infographic uses EIU cost of living data to rank the world’s most and least expensive cities to live in Read more

