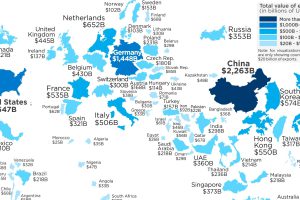
This map re-sizes countries based on the amount of goods they export abroad, giving a clear look at the world’s biggest exporters of 2017. Read more
The world’s population centers are shifting rapidly, and by 2100, it is projected that the world’s largest megacities will exceed 70 million people. Read more
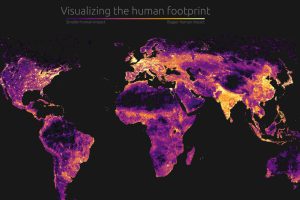
Our impact on the planet has been profound. Today’s graphic visualizes this human footprint by looking at population density, roads, undersea cables, and more. Read more
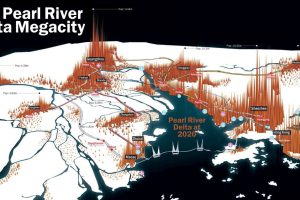
China’s Pearl River Delta, in an unprecedented growth spurt, has seen cities expand and merge to become the largest contiguous urban region in the world. Read more
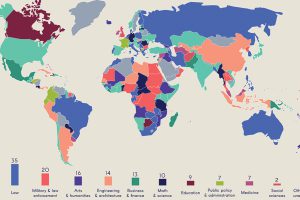
The vast majority of heads of government have some sort of post-secondary education, but their areas of study vary greatly. Read more
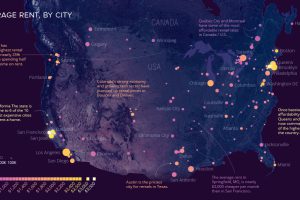
Rental markets are heating up all over the U.S. and Canada, but certain cities are now clearly in a league of their own. Where does your city fall? Read more
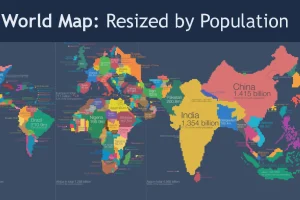
Look at global population in a whole new light, when countries on the world map are drawn based on population numbers instead of their usual borders. Read more

These maps of North America and Europe use a deceivingly simple method to plot population density: replacing each town with a single dot. Read more
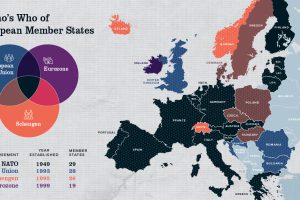
Europe has members in at least four major treaty groups. This map shows how these groups fit into the big picture of Europe’s member states. Read more

Which industries reign supreme in the United States? This map breaks down the most profitable industry, state by state. Read more

