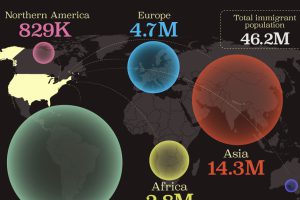
This map shows which regions U.S. immigrants came from, highlighting Asia and Latin America as the biggest sources. Read more
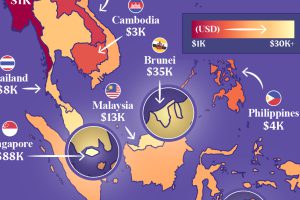
Indonesia, the region’s largest economy, makes the top five in this map exploring Southeast Asia’s GDP per capita levels. Read more

In total, only nine countries have fully legalized recreational cannabis use. Read more
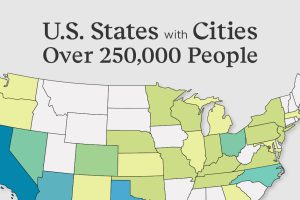
Eighteen U.S. States don’t have a single incorporated area with more than 250,000 people. Read more
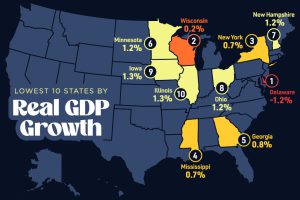
In this graphic, we show where real GDP lagged the most across America in 2023 as high interest rates weighed on state economies. Read more
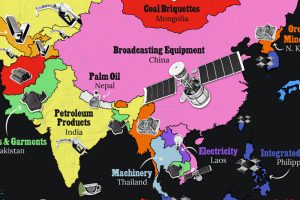
Asia’s exports span a wide range, from petroleum to technology components and textile products. Read more
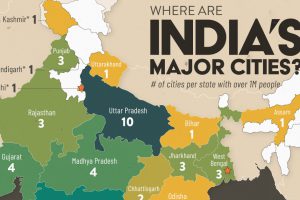
Ten Indian states—most of them from the northeast region of the country—don’t have a single city with 1 million residents. Read more

Cars and petroleum dominate the European Union exports. Read more

According to the EPA, the U.S. produced 292 million tons of solid waste in 2018, of which 150 million headed to some of the largest landfills in the country. Read more
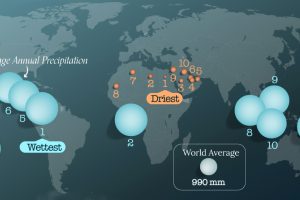
From tropical rainforests to the sandy deserts of North Africa, the world’s wettest and driest countries are a study in contrasts. Read more

