


Corporate finance oversees trillions of dollars and makes modern markets and economies possible, but who are the main players? Read more
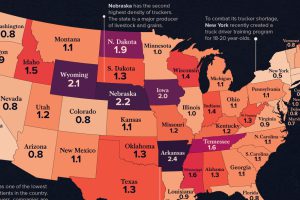
See how America’s 1.8 million truckers are distributed across the nation in these two heatmap visualizations. Read more
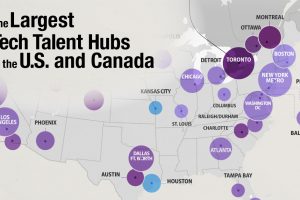
6.5 million skilled tech workers currently work in the U.S. and Canada. Here we look at the largest tech hubs across the two countries Read more
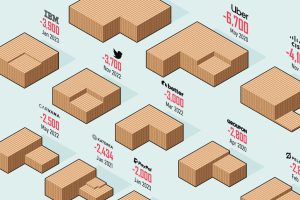
How bad are the current layoffs in the tech sector? This visual reveals the 20 biggest tech layoffs since the start of the pandemic. Read more
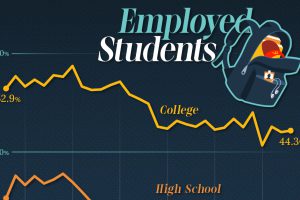
This graphic shows U.S. high school and college student employment from 1993 to 2023, based on data from the U.S. Bureau of Labor Statistics. Read more
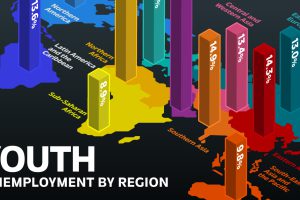
While the global youth unemployment rate dropped to a 15-year low, there were significant differences by region. Which countries had the highest rate? Read more

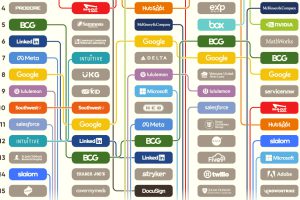
What are the best companies to work for according to new grads, based on compensation, benefits, and advancement opportunities? Read more
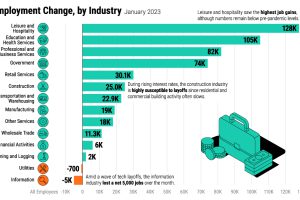
The U.S. labor market is remarkably strong, with a 3.4% unemployment rate. Which sectors are seeing the highest job gains in 2023? Read more
According to employee reviews on Glassdoor, here’s how the ranking of top-rated employers in the U.S. has changed over the last five years Read more
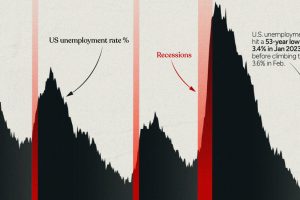
This infographic examines 50 years of data to highlight a clear visual trend: recessions are preceded by a cyclical low in unemployment. Read more