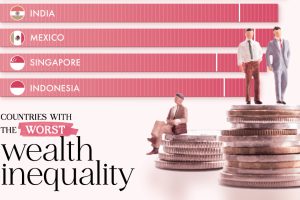
South Africa recorded the highest wealth inequality in 2023, as measured by the Gini index. Which other countries made the top 10? Read more
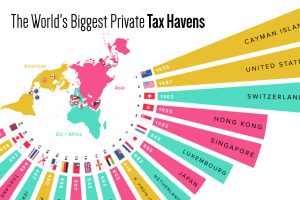
What countries or territories do the ultra-wealthy use as tax havens? Read more
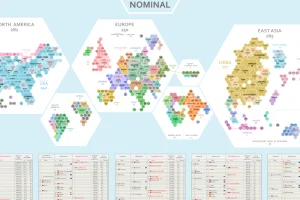
Where does the world’s economic activity take place? This cartogram shows the $94 trillion global economy divided into 1,000 hexagons. Read more
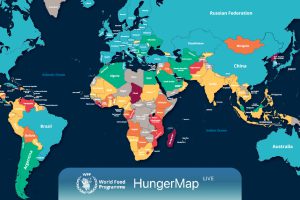
Every day, hunger affects more than 700 million people. This live map from the UN highlights where hunger is hitting hardest around the world. Read more
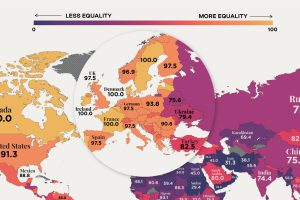
In recent years, many economies have made women’s rights a priority, yet only 10 countries in the world offer full legal protections to women. Read more
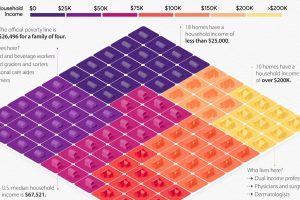
This visual breaks down U.S. household income categories as 100 homes, based on the most recent data from the U.S. Census Bureau. Read more
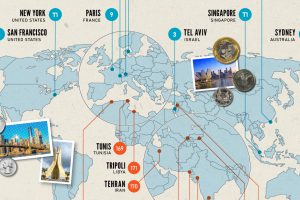
From New York to Damascus, this infographic uses EIU cost of living data to rank the world’s most and least expensive cities to live in Read more
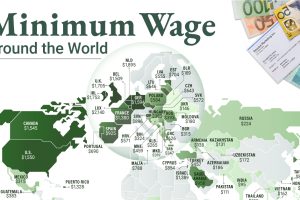
This infographic shows the net minimum wage across 67 countries, as of January 2023. A breakdown by U.S. state is also included. Read more
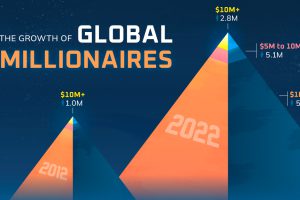
The world’s millionaire population has more than doubled in the last decade between 2012 and 2022. We visualize these numbers here. Read more

