

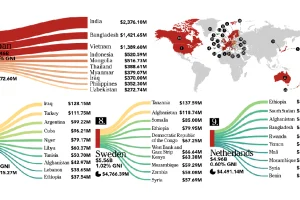
This infographic looks at who is giving – and who is receiving – the billions of dollars in foreign aid that flows between countries each year. Read more
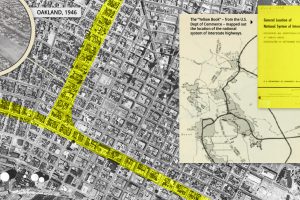
Highways improved mobility for the average American, ingraining the automobile into the urban fabric of American cities, for better and worse. Read more
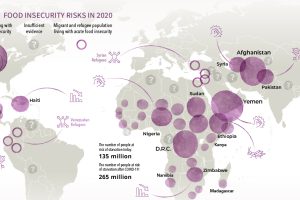
Over 135 million people face acute food insecurity worldwide—but COVID-19 could almost double these numbers. Which regions could be most affected? Read more
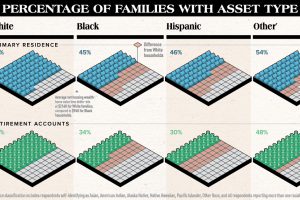
White families are more likely to hold assets of any type compared to other races. This chart highlights the substantial racial wealth gap. Read more
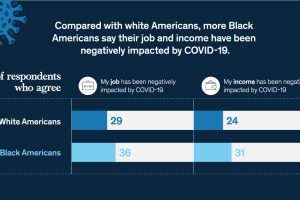
COVID-19 has worsened Black-White financial inequality, with Black Americans more likely to see negative impacts to their job and income. Read more
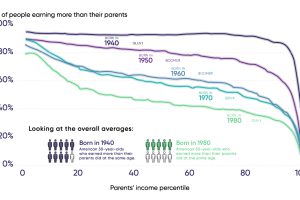
Each generation of Americans has historically earned more than their parents, but declining upward mobility is putting this growth at risk. Read more
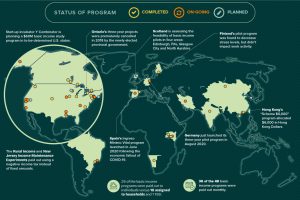
Amid the pandemic, the idea of Universal Basic Income has been gaining steam with policymakers. Where has it been tried, and has it worked? Read more
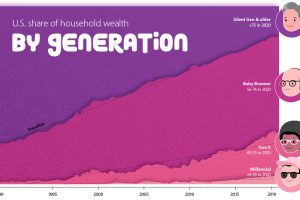
How large is the wealth gap between Millennials, Gen X, and Baby Boomers? We visualize the growing wealth disparity by generation and age. Read more
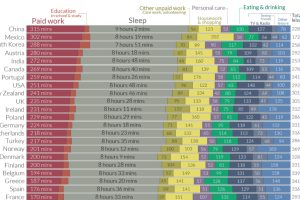
We all have the same 24 hours in the day. How do people spend them around the world, and how does this breakdown change by gender? Read more
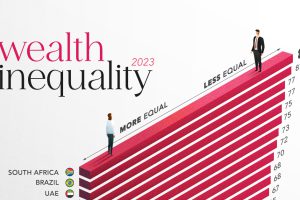
In the world’s most unequal country, the richest 10% control 80% of the wealth. In this graphic, we compare wealth inequality worldwide. Read more