


This timeline visualization is a high-level record of what happened on the fateful morning of September 11, 2001 Read more
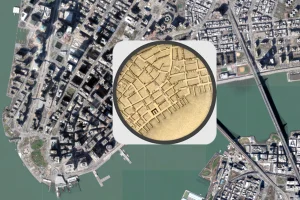
The early 1800s were a time of rapid change in New York City. This map shows the city in 1836, alongside the modern day metropolis. Read more
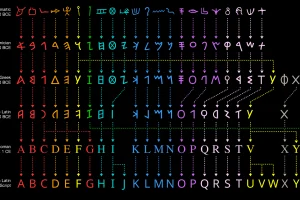
The Greek alphabet is just one part of the modern alphabet’s long evolution. Read more
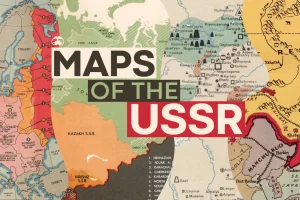
These historical maps tell the story of the USSR, and how its territorial expansion and contraction is linked to present day geopolitical events. Read more
Just how powerful are nuclear bombs? Here’s a look at the top 10 largest nuclear explosions. Read more
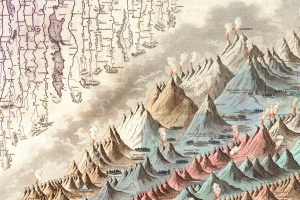
This iconic infographic map is an early and ambitious attempt to compare the world’s tallest mountains and longest rivers. Read more
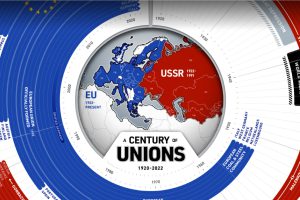
This year marks 100 years since the birth of the Soviet Union. How have countries in and near Europe aligned themselves over the last century? Read more
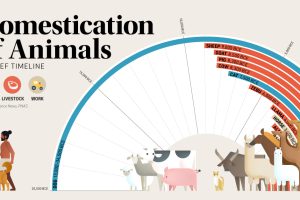
This graphic shows a timeline of when 15 different animals became domesticated, based on archaeological findings. Read more
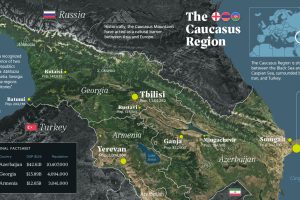
There has been intermittent fighting in the Caucasus region for decades. But what is the area like beyond the conflict? This map takes a look. Read more
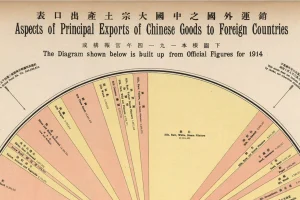
This pie chart, circa 1914, is a fascinating breakdown of China’s export economy just prior to World War I. Read more