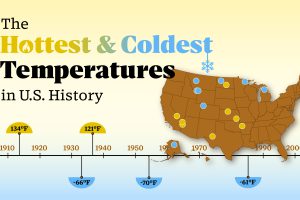
The highest temperature was registered in Death Valley, California, in 1913. Read more
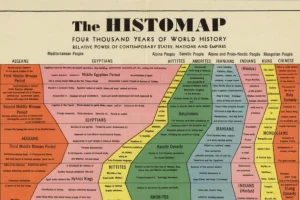
An exclusive visual guide to the rise and fall of civilization throughout human history. See what’s included. Read more

How a devastating series of cholera outbreaks in the 19th century inadvertently spurred innovation in the field of data visualization. Read more
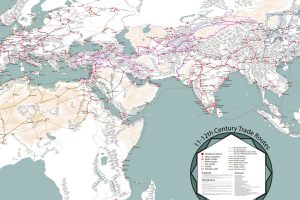
Long before container ships zig-zagged the oceans, caravans and single-sail cogs hauled goods across the world. This map is a fascinating look at that era. Read more
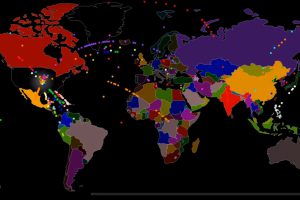
The U.S. is known as a nation of immigrants – but just who came to America, and why? This striking animation tells the story. Read more

Counting down the most astounding civil engineering projects of all time, from the Great Wall of China to the Golden Gate Bridge. What holds the #1 spot? Read more

The internet is massive and ubiquitous today, but decades ago it was limited to just a few computers. Here’s what it looked like in its early days. Read more

This month marked the 30th birthday of the World Wide Web. Here are the events that shaped it over the course of its history. Read more

When goods traveled to new regions, their native names sometimes hitchhiked along with them. This map shows the spread of loanwords around the world. Read more


