


The world lost the equivalent of almost ten soccer fields of tropical forest per minute last year. Read more
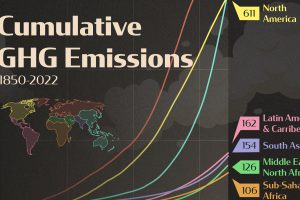
Just three regions have contributed 79% of global cumulative GHG emissions since 1850. See where they are in this graphic. Read more
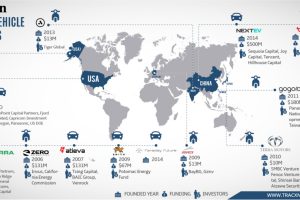
Imitation is the sincerest form of flattery. This infographic shows Tesla’s rivals that are vying to unseat the current titan of electric vehicles. Read more

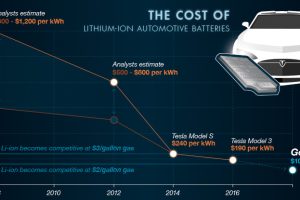
In Part 1 of our Battery Series, we look at battery basics, as well as the evolution of battery technology and how we got to today. Read more
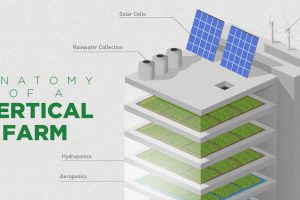
What if a skyscraper could supply sustainable farm food to the city more efficiently and profitably? This infographic explains how vertical farming works. Read more
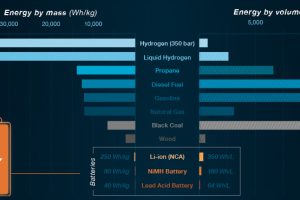
In Part 2 of the Battery Series, we show what batteries can and cannot do with today’s technology. We also look at the ideal properties of a battery. Read more
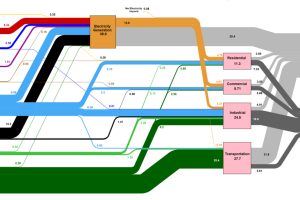
This massive diagram shows all energy created in the U.S., and where it goes. It’s not sexy, but it gives a great 10,000 ft overview of energy consumption. Read more
In Part 3 of The Battery Series, we look at the market for rechargeable batteries, as well as the exploding demand for lithium-ion batteries in particular. Read more
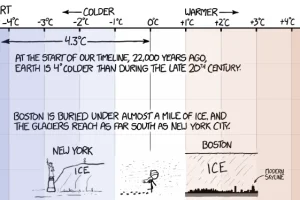
This simple and hilarious graphic is a must-see because of the excellent context it gives on changes in the earth’s temperature over the last 22,000 years Read more
Everything you need to know about Tesla Motors and the driving force behind the company: the brilliant but controversial Elon Musk. Read more