See how 14 major automakers have adopted various fuel-saving technologies in this infographic based on EPA data. Read more
A train transporting a number of potentially dangerous chemicals derailed near the Ohio–Pennsylvania border. This infographic explains what happened Read more
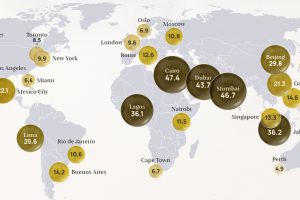
Exploring 2022 average air pollution levels around the world by PM2.5 concentration. Read more

Using 2022 average PM2.5 concentrations, we’ve ranked the most polluted cities in the world according to IQAir. Read more
We look at carbon emissions of electric, hybrid, and combustion engine vehicles through an analysis of their life cycle emissions. Read more
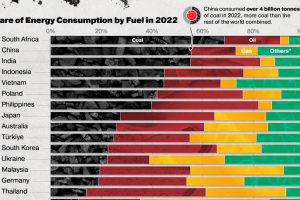
Global consumption of coal surpassed 8 billion tonnes per year for the first time in 2022. Here are the countries using the most coal. Read more
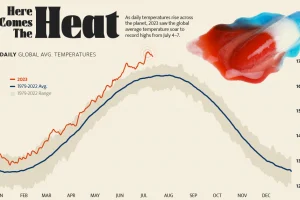
Four days straight in July 2023 set or equaled global temperature records on average. Read more

This chart highlights the different countries, and the number of people, facing water security issues around the world. Read more
Antarctica’s ice extent has reached record lows. This visual details and maps Antarctica sea ice loss over the last two years. Read more


