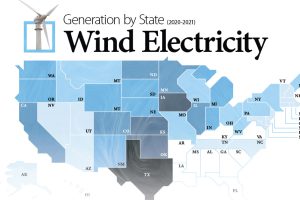
Wind energy is the largest source of renewable electricity in North America. This graphic maps U.S. states by wind electricity generation. Read more
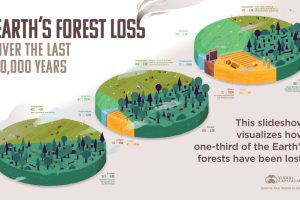
How much has the world’s land use changed over the last 10,000 years, and how have forests been impacted? Read more
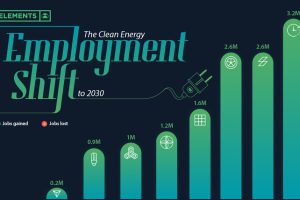
Will the clean energy transition create jobs, or will jobs be lost? Here is projected employment growth in clean energy and related sectors to 2030. Read more
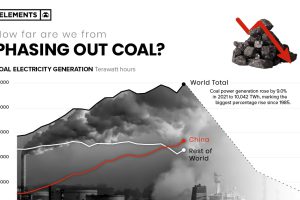
In 2021 coal-fired electricity generation reached all-time highs, rising 9% from the year prior. Here’s what it’d take to phase it out of the energy mix. Read more
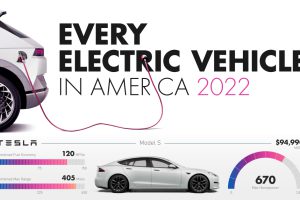
When it comes to purchasing electric cars, Americans have a few to choose from. Here’s a look at every electric vehicle sold in the U.S. Read more

Renewable energy is the foundation of the ongoing energy transition. What are the key types of renewable energy, and how do they work? Read more
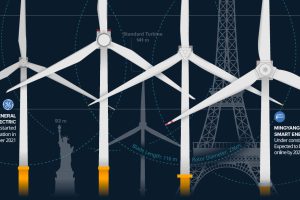
The biggest wind turbines can reach over 200 meters and cost more than $12 million to manufacture and install. Read more
More carbon in the atmosphere is creating a hotter world—and gradually fueling both climate change and instances of wildfires. Read more
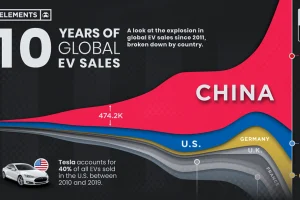
Global EV sales have grown exponentially, more than doubling in 2021 to 6.8 million units. Here’s a look at EV sales by country since 2011. Read more

The supply chain is key for the renewable energy revolution, and this chart visualizes where the world’s solar panels are manufactured. Read more

