
The Dow Jones Industrial Average is constantly evolving. This chart tracks which companies have come and gone since the inception of the index in 1928. Read more
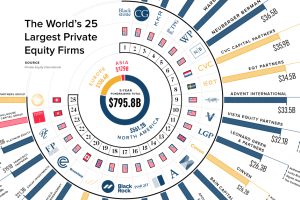
How big is private equity? We show funds raised by the largest 25 private equity firms over the last five years and their notable investments. Read more
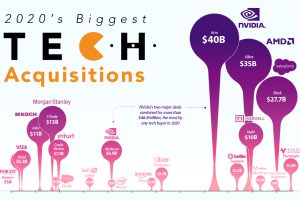
In a challenging year for most, many large tech companies have prospered and grown. We visualize the year’s biggest tech mergers and acquisitions. Read more

The world’s biggest pharmaceutical companies are worth $4.1 trillion. Here we map the top 100 companies based on their market cap value. Read more
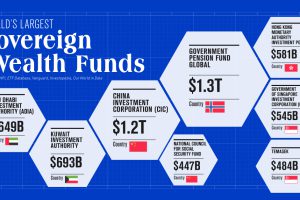
To date, only two countries have sovereign wealth funds worth over $1 trillion. Learn more about them in this infographic. Read more
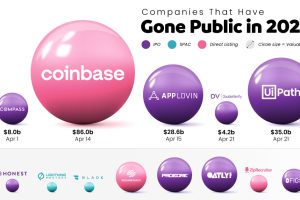
Tracking the companies that have gone public in 2021, their valuation, and how they did it. Read more

This infographic ranks the 10 most valuable bank brands over the past five years (Spoiler: U.S. banks aren’t in the top four) Read more

The U.S. dollar is the dominant currency in the global financial system, but some countries are following the trend of de-dollarization. Read more
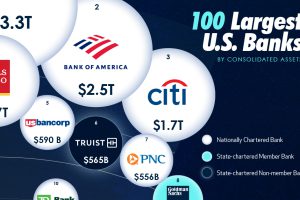
In this visual we showcase the relative size of the 100 largest U.S. banks in terms of consolidated assets. Read more
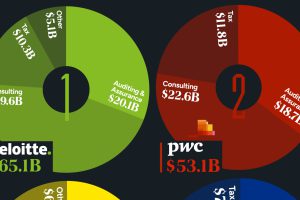
The Big Four accounting firms amassed over $200 billion in combined revenue in 2023. Read more

