

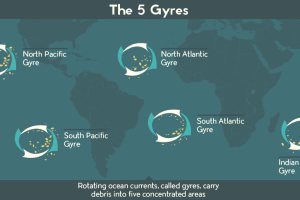
There is a staggering amount of plastic debris swirling around our oceans. This infographic and video help put this plastic problem in perspective. Read more
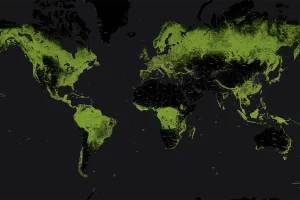
Forests cover 30% of the world’s land. These maps and charts shows where forests are flourishing, and where human activity is chipping away at the tree line. Read more
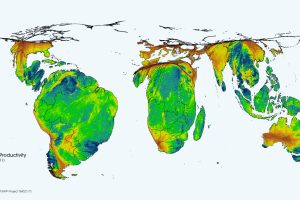
This cartogram animation shows the cycle of nature’s productivity – which resembles a rhythmic heartbeat over the course of a year. Read more
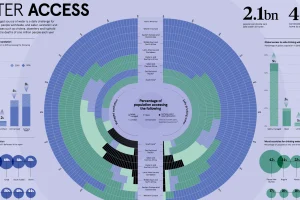
Water is the world’s most precious commodity. Yet, an estimated $260 billion is lost globally each year from the lack of basic water access and sanitation. Read more
How is technology changing the global energy game? Here’s a look at the challenges faced by the energy industry as they plan for the needs of the future. Read more
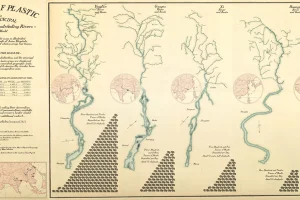
Every year, 8 million metric tons of plastic enters the world’s oceans – much of it through our river systems. See which rivers are polluting the most. Read more
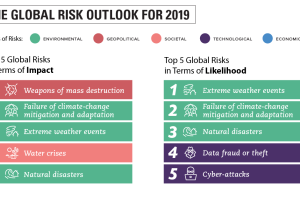
This year’s Global Risks Report helps put the world’s most pressing issues into focus by identifying the top risks for 2019. Read more
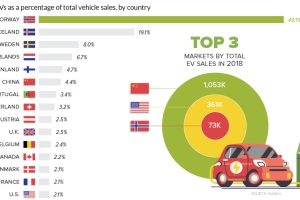
With global sales hitting new milestones and adoption rates rising, are electric vehicles now becoming a mainstream option for drivers around the world? Read more
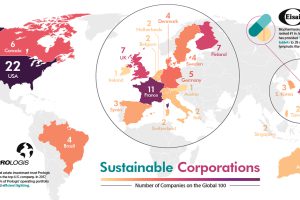
The world’s most sustainable corporations have a monumental impact on social and environmental issues. See where they are located in this visualization. Read more
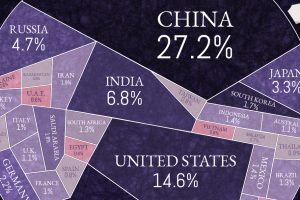
Just 15 countries are responsible for almost three quarters of the world’s carbon emissions. But what does this look like per capita, and over time? Read more