

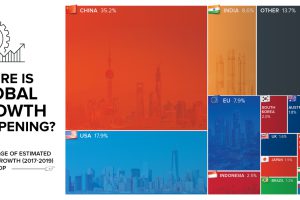
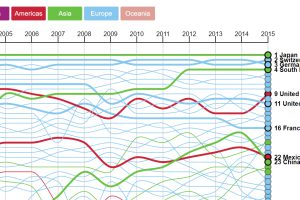
By 2019, the global economy is projected to expand another $6.5 trillion. Today’s chart shows which countries will help to fuel this global growth. Read more
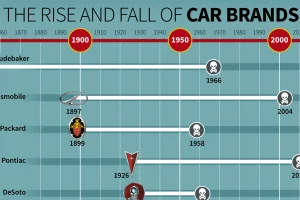
You’d be hard-pressed to find any of these 14 iconic car brands on the roads today. Here’s how these brands failed, and why. Read more
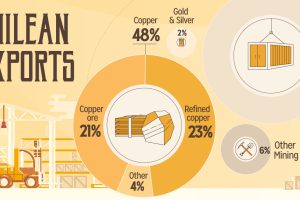
How Chile became a copper powerhouse, and how this helped to propel its economy to become the richest and freest in Latin America. Read more
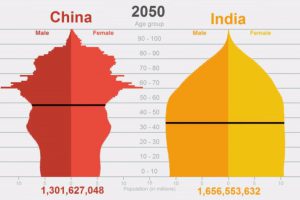
Unintended effects of China’s population control policies, the challenges of Chinese demographics, and a new population paradigm where India sits up top. Read more
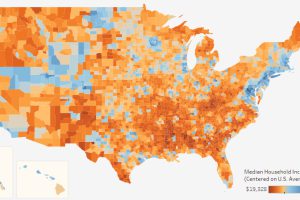
This interactive data visualization allows you to see median household income levels for every U.S. county – as well as the ability to sort data by state. Read more
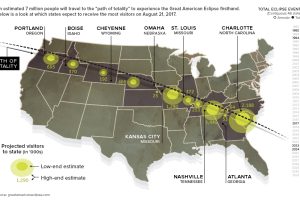
The Great American Eclipse will stretch over 12 states, and it’s being called the greatest temporary mass migration to see a natural event in U.S. history. Read more
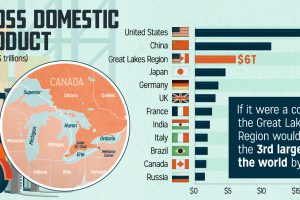
We don’t think of the Great Lakes as its own economy, but maybe we should. It’s tightly integrated by trade, and generates $6 trillion in GDP each year. Read more
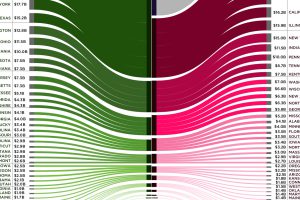
Canada is the largest international trade partner for most U.S. states – use this visualization to see how connected every state is to neighbors to the north. Read more
A ranking of the most sophisticated economies in the world – and also a look at the movers and shakers in terms of economic complexity. Read more
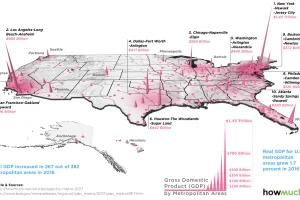
Which cities have the highest economic production in the country? This 3d map highlights GDP by metro area based on recent data. Read more