


This graphic shows the 15 richest families in Asia. From energy to banking, these dynasties have built fortunes across many sectors. Read more
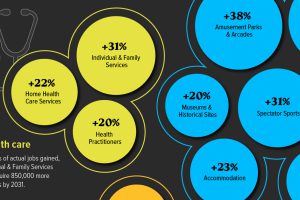
Key sectors in the U.S.—including Leisure and Health Social Services—are projected to be the fastest growing industries over the next decade. Read more
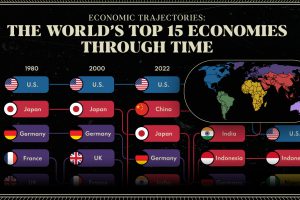
We provide a historical and predictive overview of the top economies in the world, including projections all the way to 2075. Read more
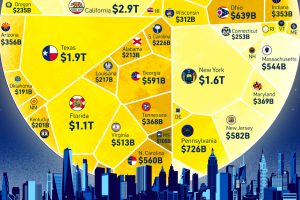
How does each state contribute to America’s overall GDP? This visualization breaks down the U.S. economy by state. Read more

Cargo that moves through airports represents the value of around 35% of world trade. These hubs move the most cargo globally. Read more

How much does each country contribute to the $105 trillion world economy in 2023, and what nations are seeing their nominal GDPs shrink? Read more
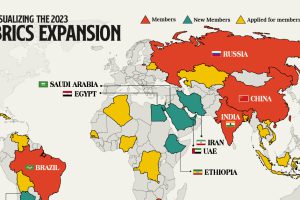
We provide a data-driven overview of how the recent BRICS expansion will grow the group’s influence and reach. Read more
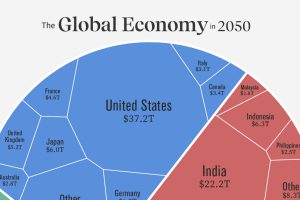
Asia is expected to represent the world’s largest share of real GDP in 2050. See how this all breaks down in one chart. Read more
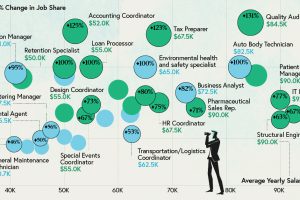
Some jobs need a degree, while others don’t. Here are the top 20 most sought-after entry level jobs with and without a degree. Read more
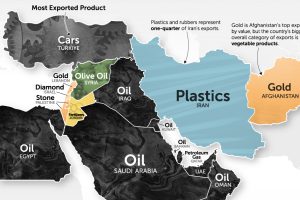
It’s more than just oil. This map of Middle East exports shows the top global product of each country by value. Read more