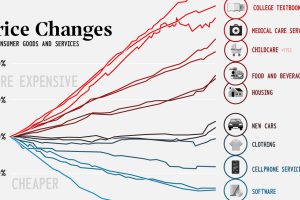
This century has seen divergent price movement. Many consumer goods are cheaper, while critical categories like health and education have skyrocketed. Read more

According to employee reviews on Glassdoor, here’s how the ranking of top-rated employers in the U.S. has changed over the last five years Read more
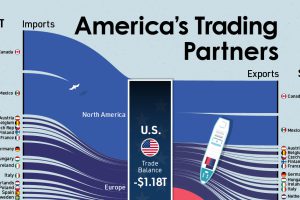
Who are the biggest trading partners of the U.S.? This visual showcases the trade balances between the U.S. and its trading partners. Read more
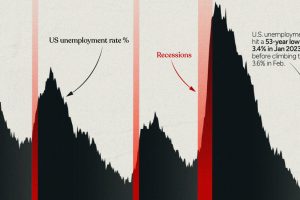
This infographic examines 50 years of data to highlight a clear visual trend: recessions are preceded by a cyclical low in unemployment. Read more
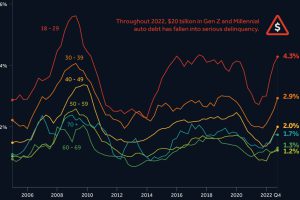
After a borrowing spree during COVID-19, younger Americans are struggling to keep up with their auto loan payments. Read more
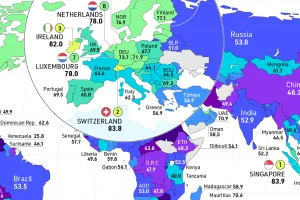
How free are people to control their own labor, property, and finances? This map reveals the state of economic freedom globally. Read more
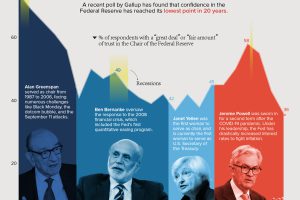
Public trust in the Federal Reserve chair has hit its lowest point in 20 years. Get the details in this infographic. Read more
Reimagining all 200 million of the American workforce as 100 people: where do they all work, what positions they hold, and what jobs they do? Read more

Empty office space is hitting record highs in 2023. We show almost 1 billion square feet of unused space stacked as a single office tower. Read more
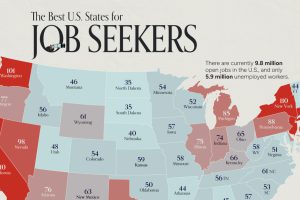
On average, there are 75 workers available for every 100 job openings across the country. Here’s how it varies by state. Read more

