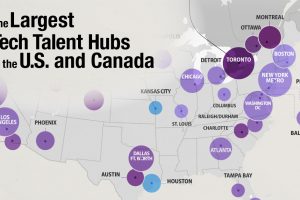
Looking to start a business? This map reveals America’s best states to do business in, analyzing everything from workforce to infrastructure. Read more
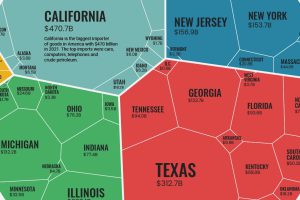
U.S. goods imports were worth $2.8T in 2021. From east coast to west, this visualization breaks down imports on a state-by-state basis Read more
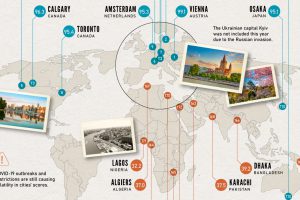
Which cities rank as the best places to live worldwide? This map reveals the world’s most and least livable cities. Read more
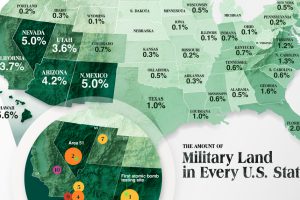
The U.S. military’s real estate portfolio is valued at $749 billion. Here’s a look at how much land the U.S. military controls in each state. Read more
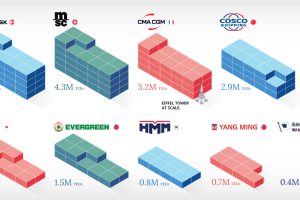
In this infographic, we rank the world’s 10 largest maritime shipping companies by container capacity and fleet size. Read more
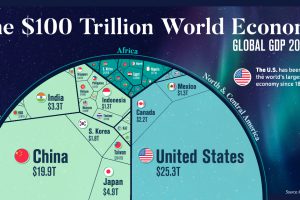
Despite ripple effects from conflict and inflation, global growth continues. According to the IMF, the global GDP will hit $104 trillion by end of year. Read more
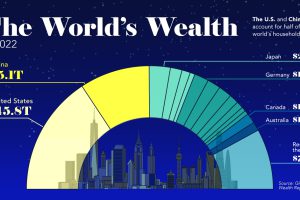
This visualization breaks down how household wealth is distributed around the world. Just 10 countries now account for 75% of total household wealth. Read more
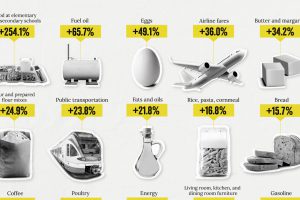
How has inflation impacted everyday goods like milk, flour, or fuel? This chart shows the annual change in the price of basic daily goods. Read more
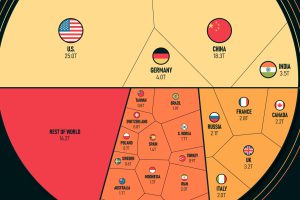
Just five countries make up more than half of the global economy. The top 25 countries make up a staggering 84% of the world’s GDP. Read more


