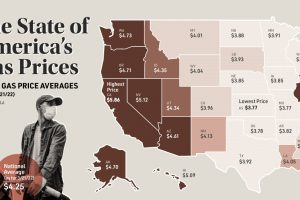
This map looks at gas prices across various states, and historical context for today’s sky-high prices at the pump. Read more

Russia faces a multitude of U.S. sanctions for its participation in global conflicts. This infographic lists who and what has been impacted. Read more
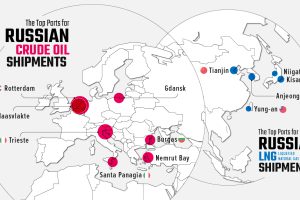
Russia’s energy exports have become a hot topic. See which ports received fossil shipments during the first 100 days of the Ukraine invasion Read more
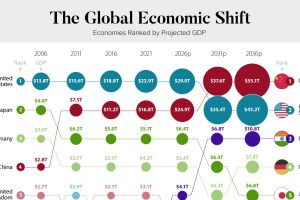
Over the next decade, China is expected to surpass the U.S. in economic power, and India is primed to become the world’s third-largest economy. Read more

U.S. trade of goods amounted to nearly $4.6 trillion in 2021, and Canada, Mexico, and China were the country’s biggest trading partners. Read more
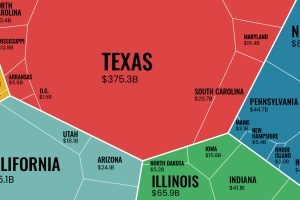
The U.S. exported $1.8 trillion worth of goods in 2021. This infographic looks at where that trade activity took place across the nation. Read more
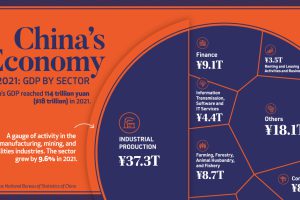
China’s economy reached a GDP of 114 trillion yuan ($18 trillion) in 2021, well above government targets. What sectors drove that growth? Read more

This visual breaks down U.S. household income categories as 100 homes, based on the most recent data from the U.S. Census Bureau. Read more
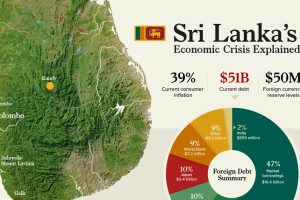
Sri Lanka is currently in an economic crisis with over $50 billion in debt and consumer inflation at 39%. So how did they get here? Read more
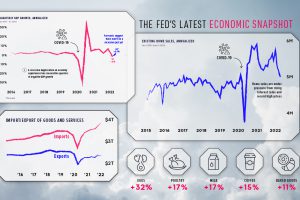
Stay up to date on the U.S. economy with this infographic summarizing the most recent Federal Reserve data released. Read more

