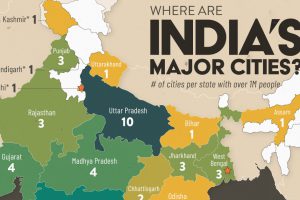
Ten Indian states—most of them from the northeast region of the country—don’t have a single city with 1 million residents. Read more
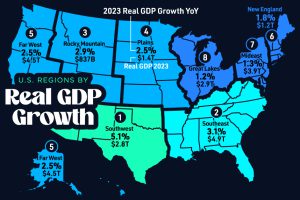
While southern regions drove economic growth in 2023, others in the north languished. We show U.S. regions, by real GDP growth last year. Read more
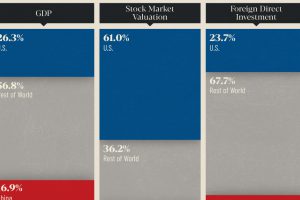
How do the world’s two largest economies compare? We look at the economies of U.S. and China across GDP, stock markets, and FDI. Read more
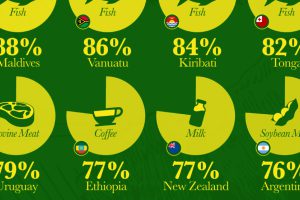
Which countries are most heavily dependent on agricultural exports to fuel their economies? We visualize the data in this chart. Read more

By popular demand from our audience, we show how the U.S. is gradually becoming a cashless society. Read more
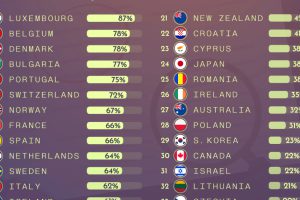
Ranking countries and their unemployment benefits, measured by the percentage of previous employed income received after a year out of work. Read more
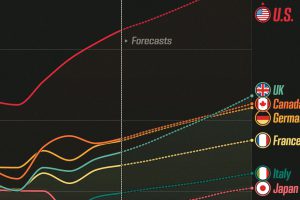
See how G7 economies are expected to perform in terms of GDP per capita, all the way to 2029. Read more
This lengthy infographic counts down the 10 most miserable countries in the world based on key economic factors such as inflation, growth, and unemployment. Read more

This graphic shows median income by state in 2024, adjusted for cost of living. Can you guess where it’s the highest? Read more
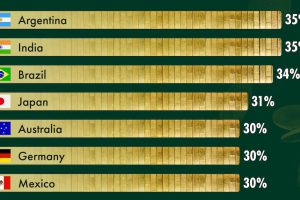
Interestingly, BRICS members cover the spectrum of corporate tax rates in the G20 from highest (India, Brazil) to lowest (Russia). Read more

