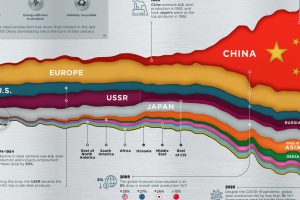
Lumber prices in the U.S. continue to break records as pressure from both the supply and demand sides of the market collide. Read more
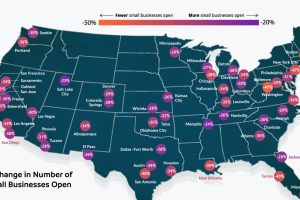
Compared to January 2020, 34% of small businesses are currently closed. This map looks at the small business recovery rate in 50 metro areas. Read more
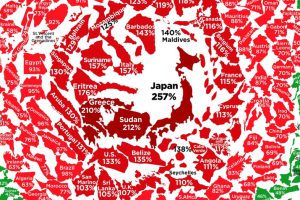
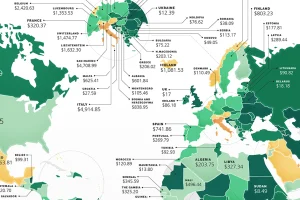
After an unprecedented borrowing spree in response to COVID-19, what does government debt look like around the world? Read more
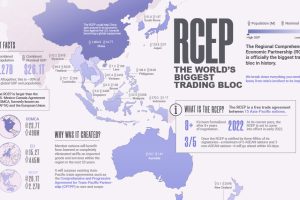
The Regional Comprehensive Economic Partnership (RCEP) covers 30% of global GDP and population. Here’s everything you need to know about it. Read more
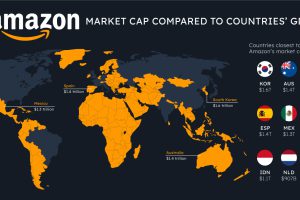
How do the big tech giants compare to entire countries? Here’s how Apple, Microsoft, and Amazon’s market caps stack up against national GDP. Read more
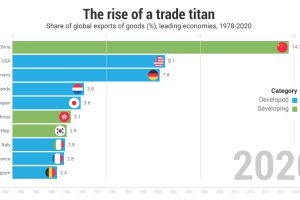
China’s economy today is completely different than 40 years ago; in 2021 the country makes up the highest share of exports globally. Read more
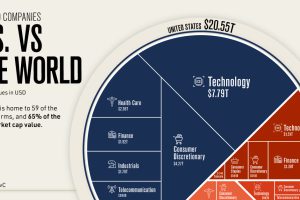
Where are the top 100 companies of the world located? We highlight the U.S. share of the top companies by market capitalization . Read more
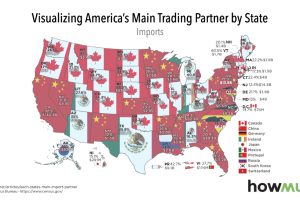
At the national level, Canada and China are top U.S. trading partners. While this generally extends to the state level, there are some surprises too. Read more
These maps show the most (and least) costly countries for starting a business by relative costs. Read more


