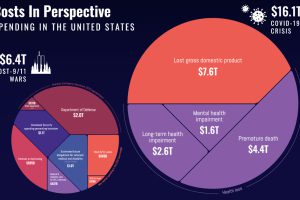
Putting the Economic Cost of COVID-19 in Perspective When it comes to the toll on human life, mental well-being, and any long-term complications, the true cost of COVID-19 can be… Read more
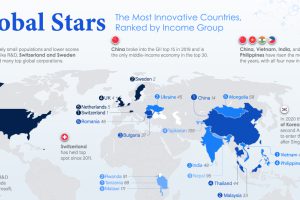
From Switzerland and China to Vietnam and Tanzania — here are the world’s most innovative countries, taking income per capita into account. Read more
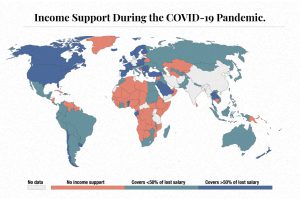
The need for income support during COVID-19 has been vast. This map visualizes different levels of income support around the world. Read more
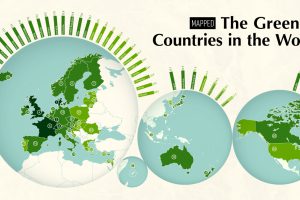
The world’s growing focus on sustainability is a clear sign of the times. This map ranks the 40 greenest countries in the world. Read more
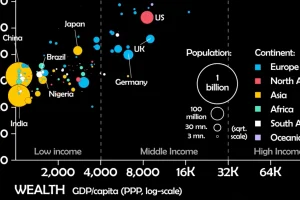
This unique animated visualization uses health and wealth measurements to chart the evolution of countries over time. Read more
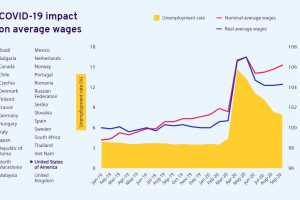
The pandemic has impacted labor in many ways. Here’s how global wages and unemployment have been affected by COVID-19 in 30 countries. Read more
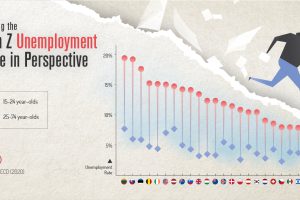
COVID-19 has impacted everyone, but one generation is taking it harder than the others. This graphic reveals the Gen Z unemployment rate. Read more
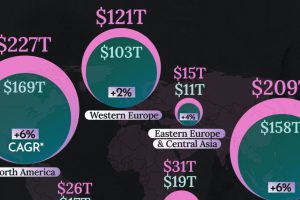
This graphic shows the latest forecasts for net wealth by region, highlighting the dominance of three key regions. Read more
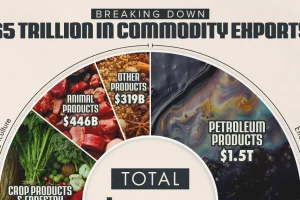
The energy sector accounts for 40% of the value of global commodity exports. And there’s a key product within it that dominates international trade. Read more


