

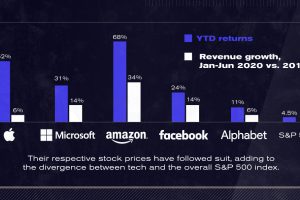
After a strong start to 2020, U.S. tech giants continue to advance to unprecedented highs. The Big Five now account for 25% of the S&P 500. Read more
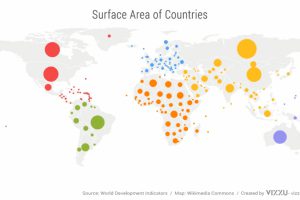
We’ve come a long way since Pangea. This short video examines the area, population, and GDP of our continents as a share of the world’s total. Read more
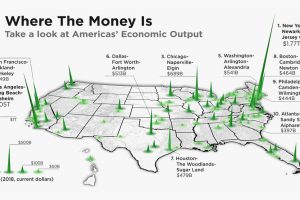
The total U.S. GDP stands at a whopping $21 trillion, but which metro areas contribute to the most in terms of economic output? Read more
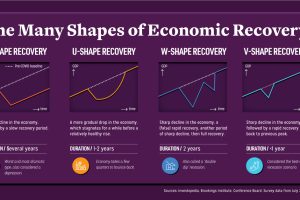
Economic recovery from COVID-19 could come in four shapes—L, U, W, and V. What do they mean, and what do global CEOs see as the most likely? Read more
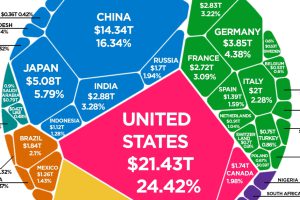
The world’s total GDP crested $88 trillion in 2019—but how are the current COVID-19 economic contractions affecting its future outlook? Read more
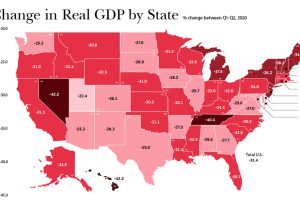
In just a few months, the U.S. economy reeled from COVID-19. As real change in GDP suffered, which states and industries were the hardest-hit? Read more

Amid trillions in COVID-19 stimulus, this graphic compares new U.S. dollars printed to U.S. precious metal coin production. Read more

The Dow Jones Industrial Average is constantly evolving. This chart tracks which companies have come and gone since the inception of the index in 1928. Read more
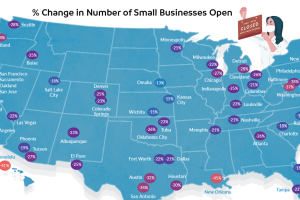
Across the U.S., 37% of small businesses are still shuttered. This map demonstrates how uneven that closure rate is in cities around the country. Read more

What makes your cup of coffee possible, and how much does it really cost? Here’s how the $200B coffee supply chain breaks down economically. Read more