


Rural counties across the U.S. are losing residents as large cities and the coasts are growing. This map shows U.S. population change by county. Read more
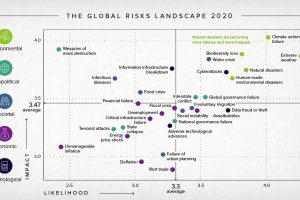
The Global Risk Report 2020 paints an unprecedented risk landscape for 2020—one dominated by climate change and other environmental concerns. Read more
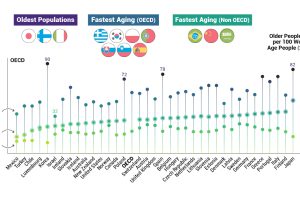
The data behind the world’s rapidly aging population, and what it could mean for the economy and future generations of retirees. Read more
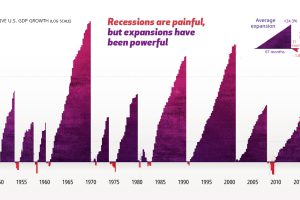
The economic cycle is a series of peaks and valleys. Analyzing economic data going back to 1950 helps put recessions into perspective. Read more

This infographic explores the importance of closing the STEM education skills gap and how it is crucial for to help future proof an uncertain global economy. Read more

This visualization tracks the high-value routes that generate the most revenue for airlines – primarily links between the world’s financial centers Read more
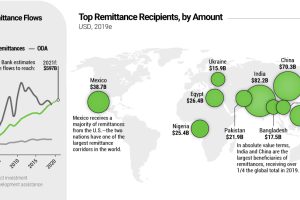
Every year, migrant workers send billions of dollars back to their home countries—reaching $550 billion in 2019. Where do these remittance flows wind up? Read more
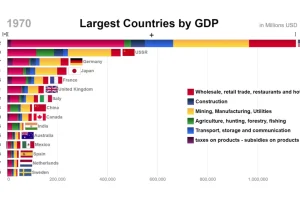
This animation looks at the top countries in the world by GDP, while also showing the components that comprised economic activity at the time. Read more
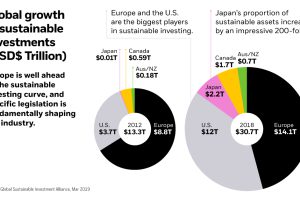
Total assets in sustainable investing reached nearly $31 trillion in 2018. What are the driving forces behind the global rise of sustainable investing? Read more
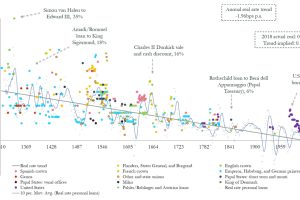
Could interest rates enter negative territory permanently? This chart plots trend data over 700 years, showing that it could be a possibility. Read more