

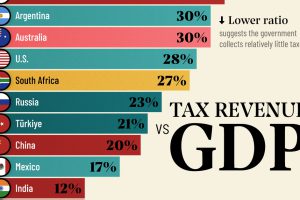
Measuring the ratio of tax revenue to economic size reveals the government’s ability to spend on public services. Read more
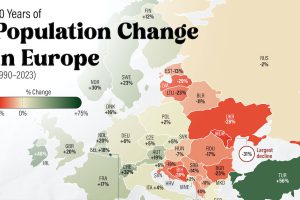
There’s an east-west divide when it comes to Europe’s population growth in the last 30 years. And it’s very apparent in this map. Read more
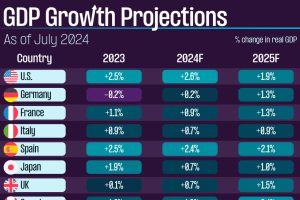
We summarize the latest GDP growth projections from the IMF, covering select economies from the developed and developing world. Read more
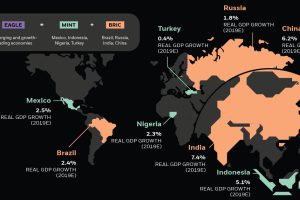
Emerging markets are ascending on the global stage and wielding more economic power—and it’s drastically altering the investment landscape. Read more
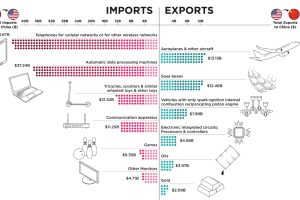
This infographic ranks the top 10 exports and imports of the U.S. and China, the two most significant global economic superpowers today. Read more
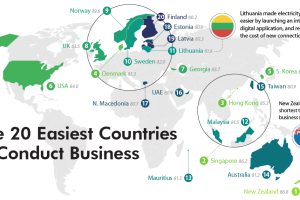
Entrepreneurship is challenging at the best of times. Here are the countries where at least starting a new business is easy to do. Read more
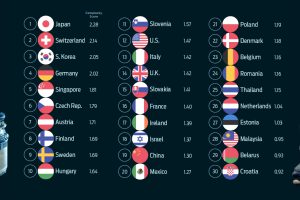
A breakdown of which factors that comprise economic complexity, and which global economies rank the highest. Read more
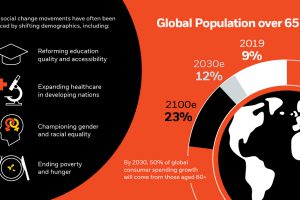
As societies evolve, demographics and social change also evolve, reshaping the world and resulting in new investment opportunities. Read more

Rural counties across the U.S. are losing residents as large cities and the coasts are growing. This map shows U.S. population change by county. Read more
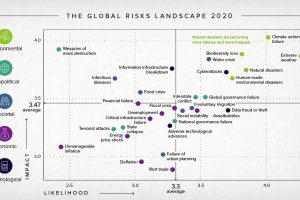
The Global Risk Report 2020 paints an unprecedented risk landscape for 2020—one dominated by climate change and other environmental concerns. Read more