

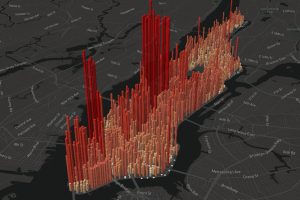
An eye-opening look at the population ‘heartbeat’ of Manhattan, which swells to an incredible four million people during an average workday. Read more
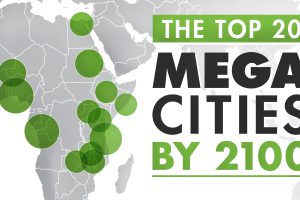
The world’s population centers are shifting rapidly, and by 2100, it is projected that the world’s largest megacities will exceed 70 million people. Read more
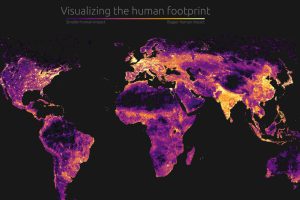
Our impact on the planet has been profound. Today’s graphic visualizes this human footprint by looking at population density, roads, undersea cables, and more. Read more

With every country’s growth visualized on a logarithmic scale, we look at a few world population growth outliers and their unique stories. Read more

Which counties have the youngest populations, and which are meccas for aging retirees? This map shows the median age of every county in the United States. Read more
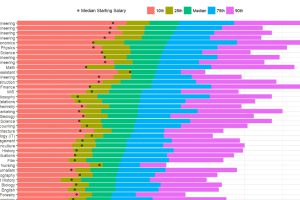
How do different college degrees compare for earning potential? This chart uses a data set from 1.2 million past students to compare 50 different majors. Read more
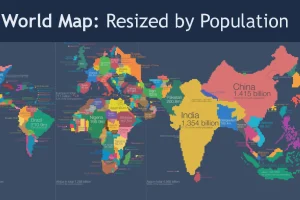
Look at global population in a whole new light, when countries on the world map are drawn based on population numbers instead of their usual borders. Read more
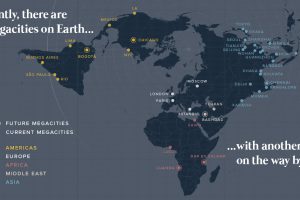
There are currently 33 megacities in the world with over 10 million inhabitants – but by 2030, there will be six new megacities, including one in the U.S. Read more

These maps of North America and Europe use a deceivingly simple method to plot population density: replacing each town with a single dot. Read more
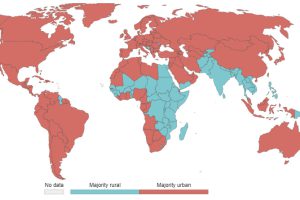
55% of the world lives in urban areas today. But what defines an urban population, and how will this big picture change by 2050? Read more