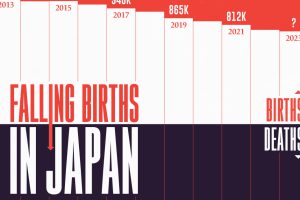
Japan’s birth rate has been declining. Here, we illustrate the number of live births each year compared to the number of annual deaths. Read more
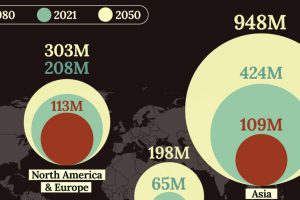
By 2050, one in six people will be aged 65 or older. Here, we map the growth of the senior population by region. Read more
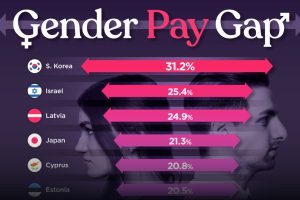
Which OECD countries have the largest gender pay gaps? We look at the 10 countries with gaps higher than the average. Read more
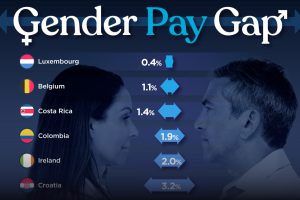
Which OECD countries have the smallest gender wage gaps? We look at the 10 countries with gaps lower than the average. Read more
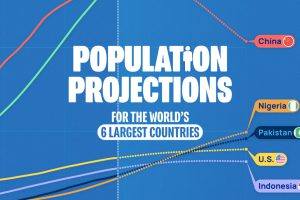
See how the world’s 6 largest countries will grow (or shrink) by 2075, based on the latest UN population projections. Read more

Gen Z is expected to add almost $9 trillion in spending globally in the next 10 years, more than any other generation. Read more
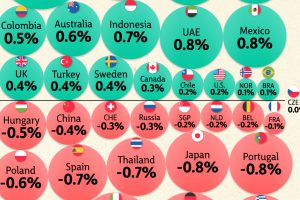
Nearly half of the world’s major economies are projected to see their working age population decline over the next decade. Read more
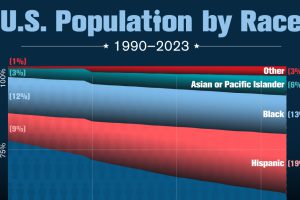
The nation’s non-white population has nearly doubled since 1990. Read more
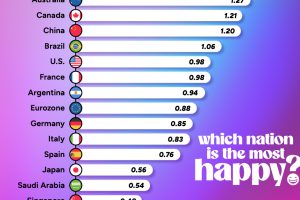
We show the happiest countries across 24 major nations, based on reported happiness and life satisfaction, among other factors. Read more
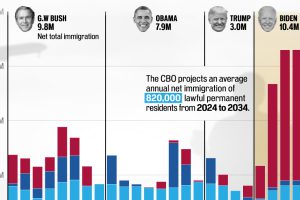
Net immigration increased the most under current U.S. President Joe Biden’s term. How do previous presidents compare? Read more

