

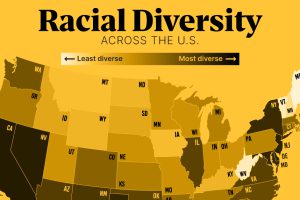
In this graphic, we show the most diverse states in the U.S. based on the Census Bureau’s Diversity Index. Read more

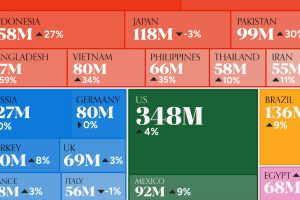
To offer perspective on the population of U.S. states, this map compares them to countries that share similar population sizes. Read more

This visual shows tobacco use by country and sex, highlighting which countries still have a high prevalence of smoking. Read more
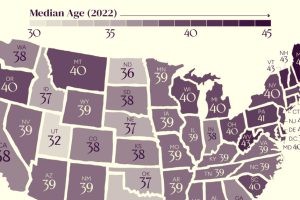
The U.S. might have a median age of 39, but the median age by state ranges from the low 30s to the mid 40s. Read more
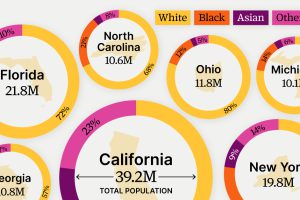
Here’s how racial diversity breaks down across the 10 largest U.S. states by population—from California to Michigan. Read more
We visualize the 20 largest consumer markets in the world in 2030—from Asian giants to North and South American powerhouses. Read more
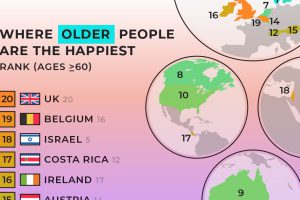
Advanced economies are the happiest countries for older people, likely due to their stronger social security systems. Read more
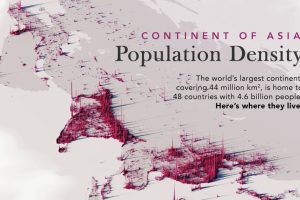
We visualize Asia’s population patterns to see where 4.6 billion people, or two-thirds of the world’s population, actually live. Read more
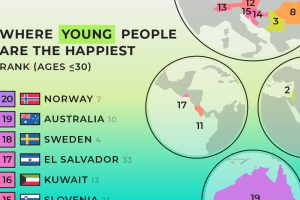
We summarized results from the World Happiness Report 2024 to see where young people are the happiest. Read more
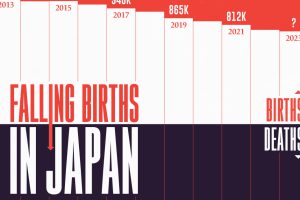
Japan’s birth rate has been declining. Here, we illustrate the number of live births each year compared to the number of annual deaths. Read more