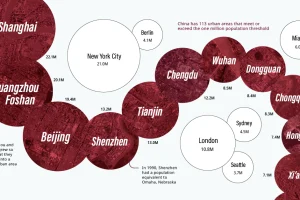
China has the same amount of 1 million+ population cities as both North America and the EU combined. Here they all are, from biggest to smallest. Read more
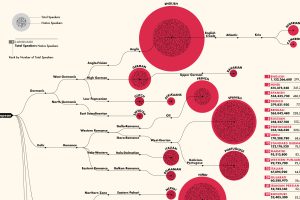
This detailed visualization breaks down the 100 most spoken languages around the world, by total and native speakers. Can you find yours on the list? Read more
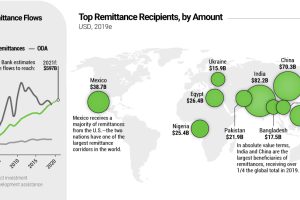
Every year, migrant workers send billions of dollars back to their home countries—reaching $550 billion in 2019. Where do these remittance flows wind up? Read more

Highways improved mobility for the average American, ingraining the automobile into the urban fabric of American cities, for better and worse. Read more
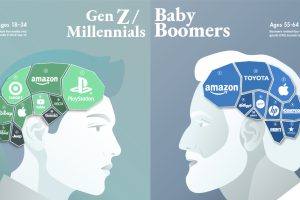
Can a brand transcend time and be all things to all people? This graphic seeks to find out by visualizing the most loved brands by generation. Read more
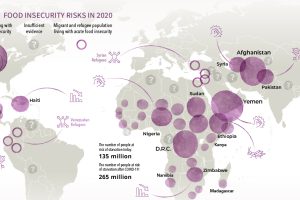
Over 135 million people face acute food insecurity worldwide—but COVID-19 could almost double these numbers. Which regions could be most affected? Read more
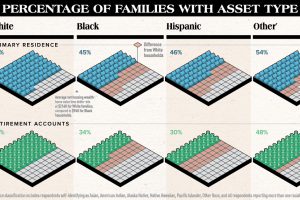
White families are more likely to hold assets of any type compared to other races. This chart highlights the substantial racial wealth gap. Read more
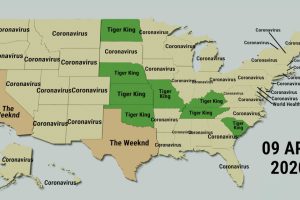
This fascinating animated map provides an overview of the top trending Google searches in every state over the last decade. Read more
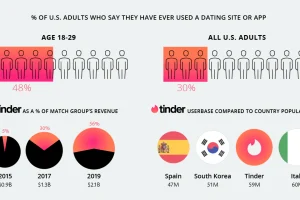
Online dating is a cultural force driven by Millennials and Gen Z. But it’s also a phenomenon dominated by just one company—Match Group. Read more
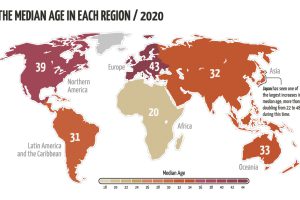
The world’s population is aging, but not at the same rate. This animated map visualizes the changes in median age in every region since 1950. Read more

