

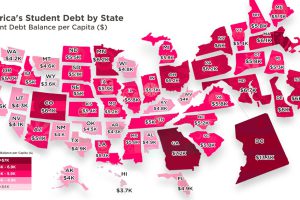
Crippling student debt in the U.S. has reached a record high of $1.5 trillion nationwide. Today’s map breaks down which states bear the highest burden. Read more

Our exclusive visual guide to the state of global debt. Read more
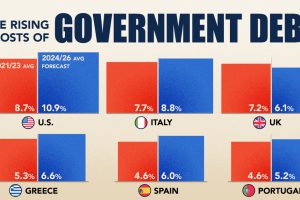
The cost of servicing the national debt is surging as high interest rates push up borrowing costs amid a rapidly growing debt pile. Read more
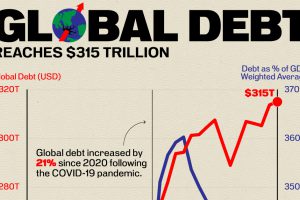
Global debt has soared to a new landmark, adding $1.3 trillion in debt in the first quarter of 2024 alone. Read more
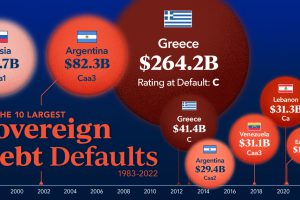
We show the 10 biggest sovereign defaults since 1983, highlighting how certain countries are repeat offenders. Read more
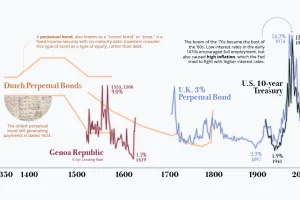
Interest rates sit near generational lows — is this the new normal, or has it been the trend all along? We show a history of interest rates in this graphic. Read more
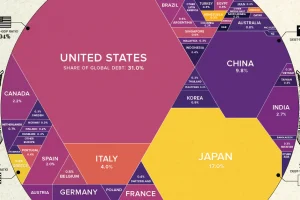
What share of government world debt does each country owe? See it all broken down in this stunning visualization. Read more
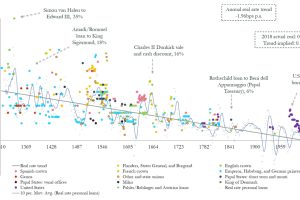
Could interest rates enter negative territory permanently? This chart plots trend data over 700 years, showing that it could be a possibility. Read more
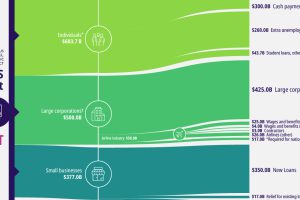
A visual breakdown of the CARES Act, the $2 trillion package to provide COVID-19 economic relief. It’s the largest stimulus bill in modern history. Read more
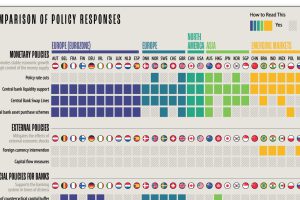
What policy tools are global central banks implementing to combat the economic effects of COVID-19? We compare the responses of 29 countries. Read more