


Millions, billions, trillions – these are abstract numbers. Here’s what $20 trillion of U.S. debt looks like in terms of cold hard cash. Read more
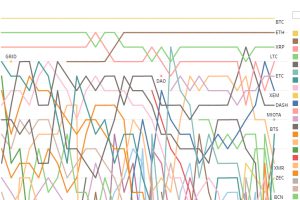
The coin universe is fast-moving and sometimes chaotic. See how the list of the top 20 cryptocurrencies has changed over the last 2.5 years. Read more

How much currency is printed each year? How long do bills last? Learn 38 facts on the modern U.S. dollar in this infographic. Read more
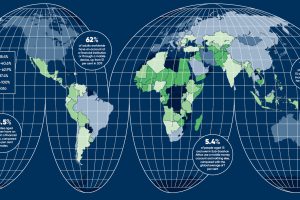
We take financial services for granted – but there are billions of people globally without them. This presents a unique opportunity to bank the ‘unbanked’. Read more

This interactive chart shows the breakeven prices that oil-rich countries need to pay for imports. We also dive into Venezuela’s specific crisis as well. Read more
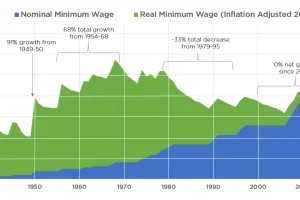
In real terms, the U.S. minimum wage peaked in value in 1968 – and it has actually dropped by more than 30% since then. Read more
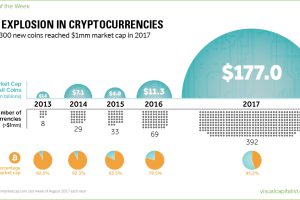
In 12 months, the number of cryptocurrencies worth >$1mm has soared by 468%. Meanwhile, the total value of all currencies together has skyrocketed by 1,466%. Read more
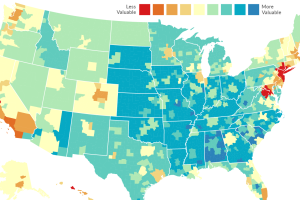
Every dollar spent is not equal. In some cities like NYC or SF, it will buy you far less – and in other places, a dollar has much more buying… Read more
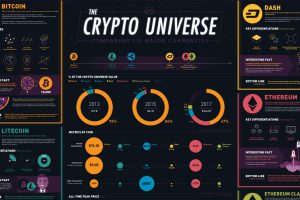
What’s the difference between Bitcoin, Ethereum, Dash, Ripple, and Litecoin? This infographic breaks it all down, as well as many other key metrics. Read more

If you’re a Canadian that invests in funds that hold U.S. companies, currency fluctuations can make a big impact on your returns. Here’s how it all works. Read more