What are the most pervasive types of financial scams? We break down nearly half a trillion dollars in losses worldwide due to scams in 2023. Read more

In this infographic, we list the most stolen vehicles in the U.S. in 2023, according to the National Insurance Crime Bureau. Read more

Here are the most commonly impersonated brands in online scams, highlighting how tech companies are prime targets in fraudulent schemes. Read more

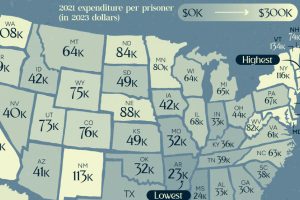
Spending can vary from just under $23K per prisioner in Arkansas to $307K per inmate in Massachusetts. Read more

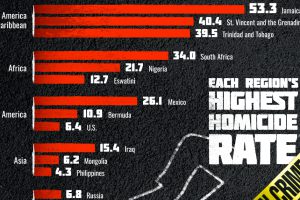
In this graphic, we show the highest homicide rates in every region worldwide, highlighting varying trends in deadly violence. Read more

The U.S. has registered 1,589 executions since 1977. Read more

The UK homicide rate is about one-sixth of the rate in the U.S. Read more

DC, the nation’s capital recorded the highest violent crime rate in 2022, at 812 incidents per 100,000 residents. Read more

In 2022, the U.S. government agency in charge with enforcing national gun laws issued 18,784 gun manufacturer licenses. Read more

How safe is small town America? This map reveals the safest cities in the U.S. in terms of the total crime rate per every 1,000 residents. Read more

