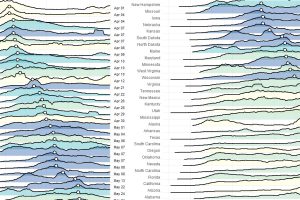
These charts and maps show the evolution of COVID-19’s spread in the United States, by organizing data based on peak case and death dates. Read more
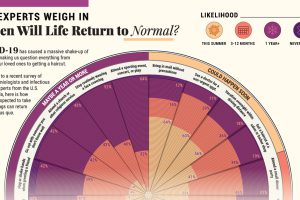
COVID-19 has caused a massive shake-up of our daily lives. Here, 511 epidemiologists offer their insights on when they might resume 20 common activities. Read more
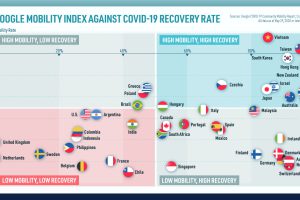
We look at mobility rates as well as COVID-19 recovery rates for 41 economies, to see which countries are reopening for business. Read more
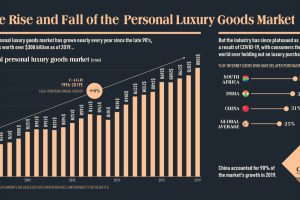
This infographic charts the rise and fall of the $308 billion global personal luxury market, and explores what the coming year holds for its growth Read more
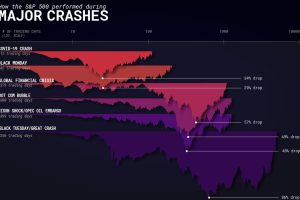
How does the COVID-19 market crash compare to previous financial crises? We navigate different contextual factors impacting crashes. Read more
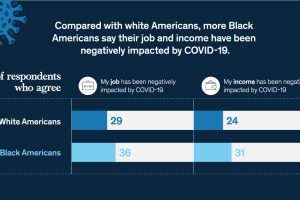
COVID-19 has worsened Black-White financial inequality, with Black Americans more likely to see negative impacts to their job and income. Read more
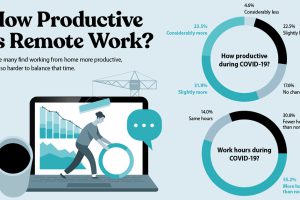
In an in-depth survey, startup founders and their teams revealed work-from-home experiences and their plans for a post-pandemic future. Read more
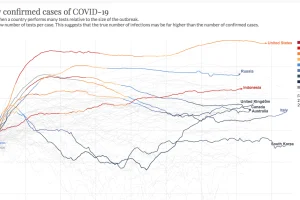
This continuously updated chart provides a more complete look at the efficacy of COVID-19 containment strategies. Read more
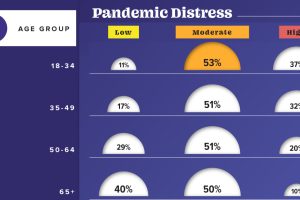
This graphic visualizes the impact of COVID-19 on emotional distress levels by different demographic subgroups such as race, education, or sex. Read more
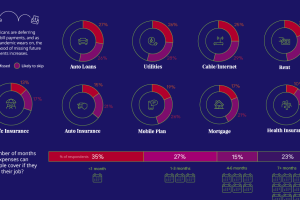
57% of U.S. consumers’ incomes have taken a hit during the pandemic. How do such financial anxieties affect the ability to pay bills on time? Read more

