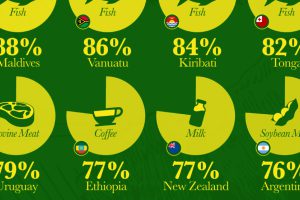
Which countries are most heavily dependent on agricultural exports to fuel their economies? We visualize the data in this chart. Read more

Saudi Aramco controls almost 259 billion barrels worth of oil and gas reserves. Read more
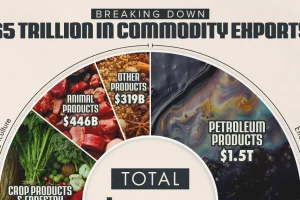
The energy sector accounts for 40% of the value of global commodity exports. And there’s a key product within it that dominates international trade. Read more
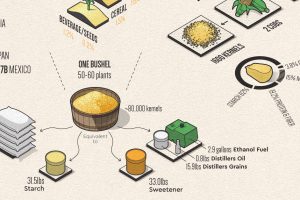
Corn has many uses that make modern life possible. This infographic breaks down U.S. corn usage in 2020. Read more
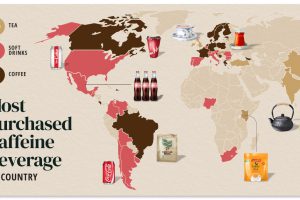
Do you drink coffee, tea, or cola? Each country has their own drink preference. Read more
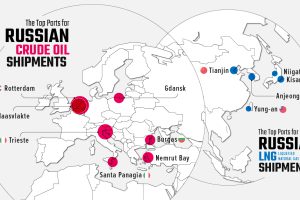
Russia’s energy exports have become a hot topic. See which ports received fossil shipments during the first 100 days of the Ukraine invasion Read more
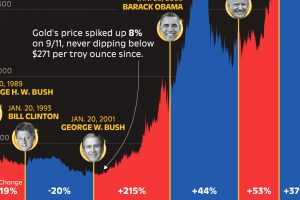
Gold prices increased by 37% during Biden’s presidency, but which U.S. president saw the greatest gold price increase during their term? Read more

This graphic illustrates Panama Canal traffic by shipment category, looking at the total number of shipping crossings and the total tonnage. Read more


